

Eaglestone Capital Partners


January 31st, 2025
Dear Partner:
Eaglestone Capital Partners LP (“Eaglestone Partners” or the “Fund”) enjoyed a profitable FY2024, generating returns for the typical limited partner as follows:

Long positions in Berkshire Hathaway (BRK.B), Tesla (TSLA), Amazon (AMZN), Bellring Brands (BRBR) and Arista Networks (ANET) were the largest contributors (in that order) to the Fund’s performance while long positions in Fox Factory Holdings (FOXF), ASML Holding NV (ASML), Installed Building Products (IBP) and IES Holdings (IESC) were the largest detractors from performance (in that order).
You cannot find “^SP500 TR Levered” in the public markets – it’s comprised of the ^SP500 Total Return” leveraged by a mix of 40% debt and 60% equity to better compare it with the levered returns of Eaglestone Partners. So for example, if the ^SP500 TR index held $100 worth of securities that appreciated 25% to $125 over FY2024, we assumed that the index financed that portfolio with 40% debt and 60% equity (hence 100/60 or 167% gross) and therefore generated an equity return of roughly $25/$60 (less a 5% cost of debt) or roughly 38% for the same period.
While Berkshire Hathaway (BRK.B), Tesla (TSLA) and Amazon (AMZN) are well known public companies, BellRing Brands (BRBR) might be new to some people.
BellRing Brands Case Study
BellRing Brands (BRBR) is a consumer-packaged goods (CPG) firm spun out of Post Holdings in March 2022. BRBR operates two brands - Premier Protein (85.5% of sales) and Dymatize (12.5% of sales) with ready to drink (RTD) protein shakes constituting the majority of Premier Protein sales.
Premier Protein Brand
-
Market leading ~23% share in the RTD convenient nutrition category which includes protein shakes and meal replacement drinks; competitors include Ensure and Muscle Milk.
-
Product line: RTD shakes (14 flavors) with 30g protein, 1g sugar, 160 calories.
-
Positioned to benefit from health & wellness trends and GLP-1 therapies, which drive muscle-preservation demand.
-
Primary consumers: older millennials and Gen X dieters seeking convenient high-protein products.
-
New, fast growing category: 90% of Premier Protein growth is from either (1) new users from outside the category or (2) increased consumption from existing users (remaining 10% of user growth comes from brand switching).
Growth Drivers
-
Elevated protein demand from GLP-1 users seeking to maintain muscle mass.
-
RTD shake household penetration (~45%) remains below bars (54%) and energy drinks (75%).
-
Premier Protein household penetration of 19% is well below leading energy drink brands with over 50% household penetration.
-
Enhanced marketing and promotional activity planned for Premier Protein in FY2025.
Eaglestone Partners investment thesis for BellRing Brands (BRBR) is simple: continue to hold the investment position so long as the business profitably grows its core Premier Protein brand from 19% household penetration towards the 50% household penetration target with an expectation that larger CPG companies will eventually become interested in an acquisition to capture BRBR’s brand name and growth prospects for themselves while allowing BRBR to better amortize marketing and distribution costs over the acquiror’s existing brand portfolio.
So which companies might purchase a fast growing $10 billion market capitalization CPG company like BRBR for a premium?
Here’s a partial list of companies selected based on their > $10 billion market capitalization, strong distribution networks and potential interest in another CPG brand. I’ve also listed their existing brand portfolios in relevant sectors such as food, beverages, consumer health, and pharmaceuticals. Interestingly, some retailers stock Premier Protein alongside the medicinal products (vitamins, nutritional supplements) while others stock it with the regular beverages.
| Potential Acquiror | Market Capitalization | Core Businesses | Relevant Brands |
|---|---|---|---|
| Johnson & Johnson | $343.4 billion | Pharmaceuticals, medical devices, and consumer health products | Splenda (sweetener), Benecol (cholesterol-lowering products) |
| The Procter & Gamble Company | $389 billion | Consumer goods, health care, and personal care products | Metamucil (fiber supplement), Align (probiotic supplement) |
| The Coca-Cola Company | $270 billion | Beverages | Fairlife (protein-enhanced milk), Core Power (protein shakes) |
| PepsiCo, Inc. | $210 billion | Food and beverages | Gatorade (sports drinks), Muscle Milk (protein products) |
| Abbott Laboratories | $200.3 billion | Health care products, including supplements | Ensure (nutritional shakes), Glucerna (diabetic nutritional shakes) |
| Nestlé S.A. | $180 billion | Food and beverage conglomerate | Boost (nutritional drinks), Nesquik, Carnation Breakfast Essentials |
| Unilever plc | $151.6 billion | Consumer goods, including food and beverages | SlimFast (meal replacement shakes), Knorr, Hellmann’s |
| Anheuser-Busch InBev SA/NV | $103.4 billion | Beverages, primarily alcoholic | Budweiser, Corona, Michelob Ultra |
| Mondelez International, Inc. | $76 billion | Snacks and beverages | BelVita (breakfast biscuits), Enjoy Life (allergy-friendly snacks) |
| GSK plc | $71.7 billion | Pharmaceuticals and consumer health products | Horlicks (malted milk drink) (acquired from Unilever in 2020) |
| Danone S.A. | $45.1 billion | Dairy and plant-based products, early life nutrition, medical nutrition | Danone (dairy products), Nutricia (medical nutrition) |
| Reckitt Benckiser Group plc | $41.25 billion | Consumer health, hygiene, and home products | Enfamil (infant formula), Airborne (supplements) |
| The Kraft Heinz Company | $36.7 billion | Food and beverage products | Oscar Mayer (meats), Planters (nuts) |
| General Mills, Inc. | $35.2 billion | Consumer foods | Yoplait (yogurt), Nature Valley (snack bars) |
| Kellanova | $27.5 billion | Cereals and convenience foods | Special K (protein meal bars and shakes), Kashi (health foods) |
| Bayer AG | $19.8 billion | Pharmaceuticals and consumer health products | One A Day (vitamins), Flintstones (children’s vitamins) |
| Hormel Foods Corporation | $17.6 billion | Food products | Vital Cuisine, MedPass, (sold CytoSport to Pepsi) |
| Conagra Brands, Inc. | $17.5 billion | Packaged foods | Slim Jim (meat snacks), Healthy Choice (frozen meals) |
| Mars, Incorporated | Private | Confectionery, pet care, and other food products | Snickers Protein (protein bars), Mars Protein (protein powders) |
(Market capitalization figures are approximate as of December 31, 2024, based on publicly available financial data. )
While Eaglestone Partners sold Fox Factory Holdings (FOXF) early in FY2024 after earnings failed to live up to the promised turnaround and the stock price subsequently declined 10% below our purchase price in early FY2024, Eaglestone Partners still holds positions in ASML Holding NV (ASML), Installed Building Products (IBP) and IES Holdings (IESC).
IES Holdings (IESC) Investment Case Study

A key driver behind Eaglestone Capital’s investment in IES Holdings (IESC) – a Houston, TX based engineering, procurement and construction (EPC) firm – are the massive investments being made in the construction of U.S. data centers by the large hyper-scalers. Interestingly, the firm hasn’t attracted any Wall Street research, partially because its unique ownership structure has removed the classic “agency problem” and allowed management to focus on equity returns. IESC is run by Mr. Jeff Gendell – he has been CEO since October 1, 2020 and previously beginning November 2016, he served as Chairman of the Board. Jeff is the founder and managing member of Tontine Associates, L.L.C. (Tontine) which is also the majority shareholder of the Company (they own 54.77% of the outstanding shares). Tontine exercises control through the same class of shares that Eaglestone Partners owns in the public markets and hence we feel there is an alignment of interests. Eaglestone Partner’s investment in IESC allows the partnership to profit from (1) excitement in AI without having to worry about which LLM, hardware or even hyper-scaler will emerge as the winner of this new era (2) continued growth in on-line retailing and the build-out of additional distribution centers and (3) any future recovery in new-build residential housing.
After studying the AI supply chain, Eaglestone Partners decided that the EPC firms occupied an interesting position. Once you had some exposure to ASML, TSMC, your favorite hyper-scalers and perhaps a key infrastructure product (like Arista switches), where else could you invest with some degree of confidence? The EPC firms occupy a unique position – hyper-scalers spending billions on silicon chips, networking equipment and power solutions for new data centers require an EPC who is capable, reliable and efficient. We found that EPC firms focusing on skilled electrical, HVAC, plumbing (cooling) and power generation were in huge demand and often their ability to attract upfront or generous payment terms for in-demand projects have allowed them to reduce their debt and improve working capital dynamics. IESC has been careful to balance its growth through a mix of organic (as witnessed through increases in working capital) and acquisitions and in the process kept down its leverage.

What are Eaglestone Partners value realization plans? While there are many larger public EPC firms that would be interested in acquiring IESC its unclear that such an exit is necessary to achieve our forecasted returns.
AI CapEx Fears: Lessons from the DotCom Era - Cisco Systems Case Study
I often look back to see if I can learn from past mistakes. Given recent excitement around the Chinese LLM “DeepSeek” and the subsequent $450 billion decline in the market capitalization of AI “story stock” Nvidia over the week ending January 31, 2025, perhaps a case study on another hardware-focused tech stock, Cisco Systems, will provide “signals” to help better understand today’s AI-enhanced stock market.
CEO John Chambers began the Cisco Systems (“Cisco”) FY 2000 annual report as follows:
“Over the next two decades, the Internet economy will bring about more dramatic changes in the way we work, live, play and learn than we witnessed during the last 200 years of the Industrial Revolution.”
Sound familiar? While I believe this prediction regarding the internet was indeed correct, the stock market capitalization of Cisco fell about 85% from $550 billion as of March 31, 2000 to around $83 billion by the end of October 2001. Cisco was the 4th largest company in the S&P 500 as of December 31, 2000 representing about 2.4% of the S&P 500 market capitalization.
Cisco Systems focused on convincing corporate customers to spend money on Cisco’s networking equipment such as routers and switches with the expectation that better and faster internet access would increase that customer’s existing productivity and lower their cost structure. As the FY 2000 annual report explains:
“There is a direct correlation between the strength of this economy and the unprecedented productivity gains we are witnessing today. We refer to this phenomenon as the “Network Effect” which is the result of information technology becoming networked and Internet applications being used to re-engineer business processes. Companies that understand the Network Effect can gain competitive advantage by quickly detecting and responding to situations such as real-time changes in customer demand.”
Acquisitions formed a key component of Cisco’s business model. From FY1993 to FY2000, they purchased 65 businesses – unfortunately as part of the process, they increased their share count by over 30%. Cisco’s quarterly earnings releases focused on the tremendous acquisition-fueled revenue and adjusted earnings growth while ignoring their growing costs. For example, the FY2000 earnings release focused on the 55% growth in topline revenues and 47% growth in adjusted EPS while ignoring the fact that GAAP EPS only grew at half that pace – expenses were growing faster than revenues.
There were other red flags: at its peak in FY2000 Cisco was trading at 29x revenues, 203x earnings and 305x operating cash flow less capex but high valuations hadn’t held back Cisco’s share price in the past. Finally, there does appear a curious $1 billion spike in customer accounts receivable (AR) in FY 2000 – in previous years AR remained stable - was this some form of vendor financing that was helping to increase sales?
The S&P 500 Index peaked at 1527 on March 24th, 2000 and after a volatile spring and summer it managed to rise to 1515 on August 28th, 2000 before beginning a slide that didn’t bottom for another two years. Throughout FY 2000 there’s no hint of a slowdown in Cisco’s topline revenues – in fact, Cisco’s major clients didn’t begin to really cut back on their spending (and hence Cisco’s revenues didn’t begin to decline) until the latter half of 2001, well after Cisco’s share price had tumbled 85%.
So let’s continue down the supply chain to better understand Cisco’s clients. Over 50% of Cisco’s sales came from the major global telecom companies who apparently believed that massive investor interest in the internet and mobile telephony was a signal to ‘grow at any cost’. In FY 2000 the largest global telcos were NTT (Japan), AT&T (US), Deutsche Telekom (Germany) and Vodafone (UK).
Several years prior to this time, governments all over the world, led by the US, opened their telecom markets to competition. While causation is unclear, there was a subsequent ‘boom’ in network capacity buildouts, mergers and acquisitions.
For example, after the U.S. congress passed the Telecommunications Act of 1996, over $500 billion dollars of capital flooded in, mostly debt financed, as existing firms and new ones began building massively parallel networks.
However, by FY2000 companies began to realize that there simply wasn’t enough business to go around, and they raced “to gain market share” in a burst of “hypercompetition” and “vicious price wars” that drove down revenues. So much long-distance capacity was added in North America, for example, that no more than two percent was being used by 2002. With the fixed costs of these new networks so high and the marginal costs of sending signals over them so low, it is not a surprise that competition forced prices down to the point where many firms lost the ability to service their debts.
At the same time, the Federal Reserve was relentlessly raising interest rates – from June 30th, 1999 to May 17th, 2000 the Fed raised rates 175bps - from 4.75% on June 30th, 1999 to 6.5% on May 17th, 2000 - even after the equity markets started to decline in March 2000. Interestingly, WorldCom (a darling of that era) saw its stock price peak in June of 1999 after which it attempted to merge with Sprint in October 1999 – fortunately for Sprint the deal was called off due to regulatory concerns in June 2000. WorldCom subsequently began to unravel, finally declaring bankruptcy in July 2002.
So what can we learn from the telecom bust of FY 2000? When your largest companies are spending billions in capex on “exciting” new projects, carefully track the investment returns and follow the money.
AMZN, GOOG, MSFT and META are anticipated to spend a combined $325 billion in capital expenditure over the course of FY2025, a 33% increase over the $244.3 billion spent on capital expenditures in FY2024. Interestingly, this represents a slowdown from the 63% increase in capex spending by these hyper-scalers from FY2023 to FY2024.
Looking back at FY2024, we can observe the trailing returns earned by these businesses on the massive increases in capex spending. As detailed below, we observe that returns on invested capital – “ROIC”: a metric that tracks after tax operating profits divided by net debt plus equity capital – generally held firm despite the 63% year over year increase in capex.
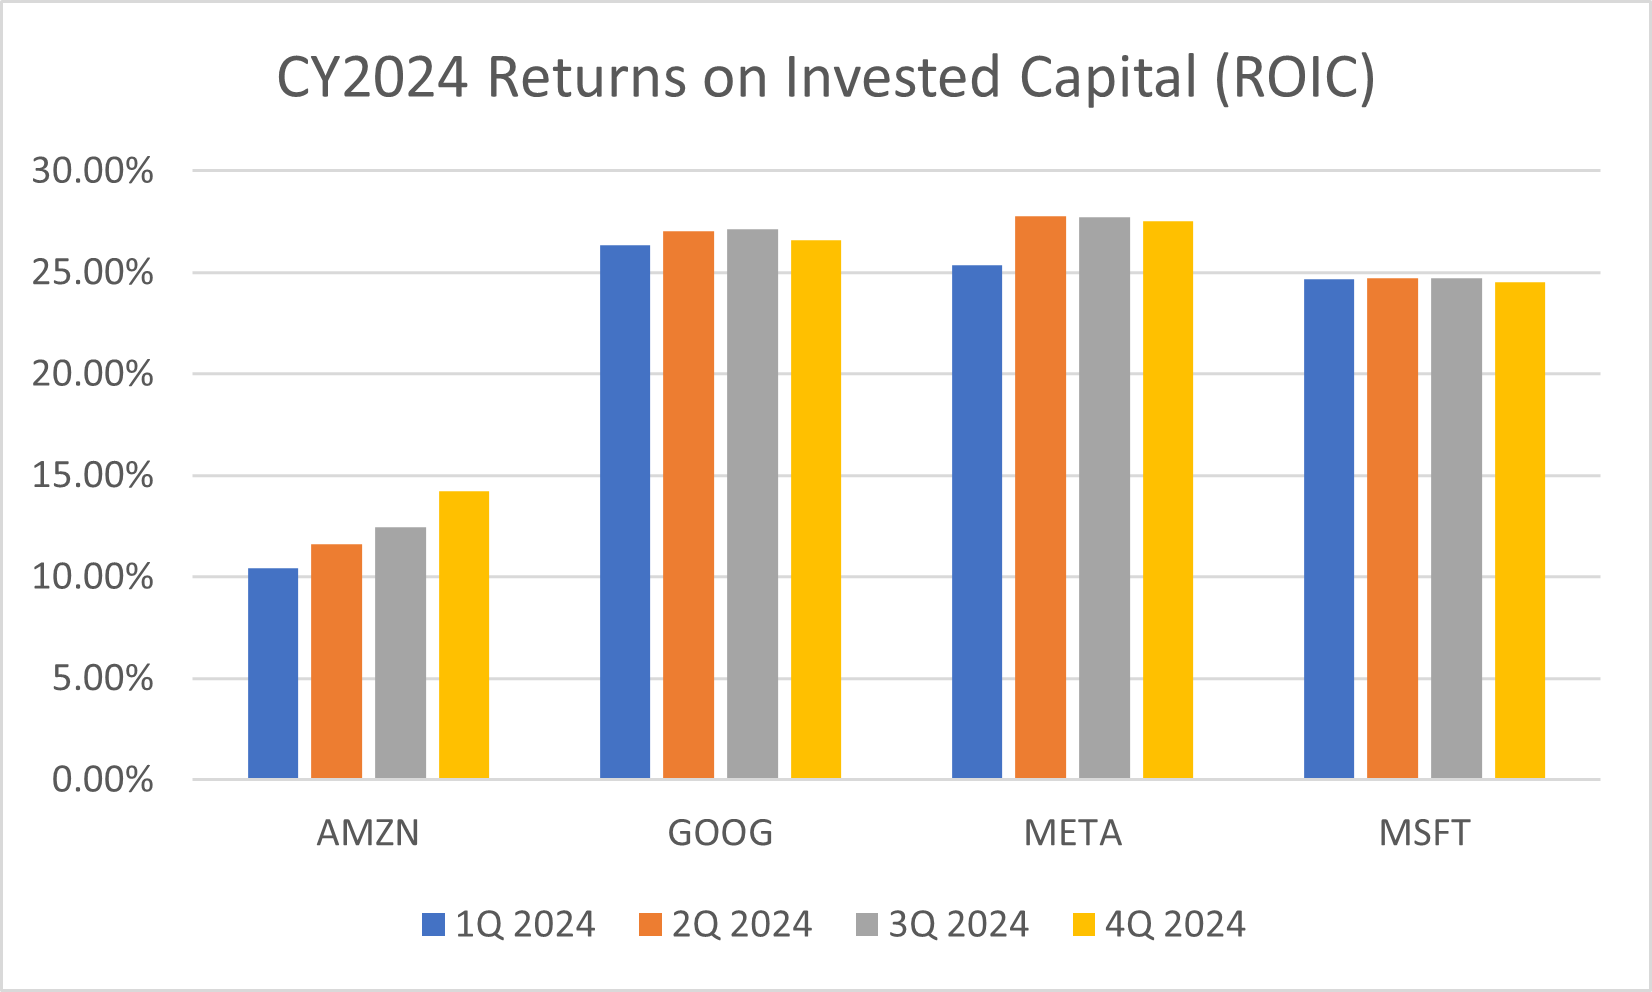
Notice the constant ramp in AMZN’s quarterly ROIC – AMZN’s operating margin of 11% (4Q2024) is greatly enhanced by the growth in their AWS cloud business with a 37% operating margin (4Q2024) while MSFT’s 45% operating margin (4Q2024) is similar to MSFT intelligent cloud’s 42.5% operating margin (4Q2024), GOOG’s 32% operating margin is still higher than GOOG Cloud’s 17.6% operating margin (though it has been rapidly rising) and META’s 42% operating margin (4Q2024) doesn’t include any third party cloud hosting. So for AMZN, increasing its AWS capex is a ‘no brainer’ – AWS is growing much faster and at a margin almost 3x greater than its core business.
Let’s see what FY2025 brings.
Regards,
Eaglestone Capital Management LLC
66 Palmer Avenue, Suite 32B,
Bronxville, NY 10708 914.202.8811
Eaglestone Capital Management LLC prepared this letter. NAV Fund Services, our administrator, is responsible for the distribution of this information and not its content.
Eaglestone Capital’s Investment Philosophy
Eaglestone Capital is an independent registered investment adviser (RIA) based in Bronxville, NY, founded by Fred Stupart. It serves as the sole investment adviser to Eaglestone Capital Partners LP (the “Fund”), which targets 15% absolute annual returns to its limited partners through investments in daily-liquid securities. The Fund primarily invests in U.S. equities and may employ leverage to boost returns. The Fund offers an alternative to the array of index funds, annuities, and other common products available to individuals seeking a secure retirement.
Eaglestone Capital views the U.S. economy as sui generis —truly one of a kind: unparalleled, irreplaceable, and impossible to replicate. Consequently, applying insights drawn from U.S. data to other markets can yield misleading conclusions. Furthermore, the foundation of continued U.S. economic growth—encompassing employment gains, real estate appreciation, and other asset expansion—is its dynamic, highly competitive private sector, exemplified by many publicly traded firms. As a result, investing in high-quality U.S. companies that uphold shareholder rights is vital to any robust investment strategy. Furthermore, Eaglestone Capital appreciates the opportunities available outside the U.S. but prefers to invest with U.S. companies with foreign subsidiaries as the best means of taking advantage of such non-U.S. opportunities.
Eaglestone Capital also believes in the individual’s power to independently analyze and choose their path to economic freedom. Today’s investors are well-informed and enjoy abundant investment choices. Although we applaud rising participation in U.S. equity markets, the growing concentration of a few companies in major equity indexes could dampen equity index returns if margins or topline growth at those companies decline and investors become more selective.
Eaglestone Capital believes that intelligence, effort, and patience yield the best results. While this should be self-evident, many index fund philosophies conflict with it. When Jack Bogle introduced the S&P 500 index fund in 1976, he offered a new, low-cost product that helped keep large asset managers honest. Yet what is initially a clever innovation often becomes overused. We may soon see many index funds lag behind AI-empowered active managers able to allocate capital more flexibly.
Eaglestone Capital oversees a portfolio of 20–30 liquid equities, each run by leadership teams possessing a “fiduciary gene”—managers who respect shareholder rights and strive to develop innovative, capital-efficient businesses that deliver strong returns to owners. Eaglestone Capital recognizes that risks and rewards vary widely across the U.S. economy, welcoming multiple industries and business models into its portfolio. Some firms have attained scale and efficiency and thus generate high margins and robust returns on capital. Others, analogous to partially finished real estate developments, still have room to grow margins and returns on capital and hence during this “development phase” they might appear to have very high valuations based on traditional EV/EBIT or P/E multiples.
Finally, Eaglestone Capital acknowledges the U.S. equity market’s potential volatility, as shifting momentum can strongly influence investor behavior. However, Eaglestone Capital does not equate volatility with risk – in fact, volatility is a key benefit available only to public market investors seeking high absolute returns. Sometimes “the market” decides that it wants to sell stocks – Eaglestone Capital respects the market’s momentum, appreciates its power and will wait for an appropriate time to exercise any judgement.
General Disclaimer
By accepting this investment letter, you agree that you will not divulge any information contained herein to any other party. This letter and its contents are confidential and proprietary information of the Fund and any reproduction of this information, in whole or in part, without the prior written consent of the Fund is prohibited.
The information contained in this letter reflects the opinions and projections of Eaglestone Capital Management LLC (the “General Partner”) and its affiliates as of the date of publication, which are subject to change without notice at any time after the date of issue. All information provided is for informational purposes only and should not be deemed as investment advice or a recommendation to purchase or sell any specific security. All performance results are based on the net asset value of the Fund. Net performance results are presented net of management fees, brokerage commissions, administrative expenses, and accrued performance allocation, as indicated, and include the reinvestment of all dividends, interest, and capital gains. The performance results represent Fund-level returns and are not an estimate of any specific investor’s actual performance, which may be materially different from such performance depending on numerous factors.
The market indices appearing in this letter have been selected for the purpose of comparing the performance of an investment in the Fund with certain well-known equity benchmarks. Statistical data regarding the indices has been obtained from public sources and the returns are calculated assuming all dividends are reinvested. The indices are not subject to any of the fees or expenses to which the funds are subject and may involve significantly less risk than the Fund. The Fund is not restricted to investing in those securities which comprise these indices, its performance may or may not correlate to these indices, and it should not be considered a proxy for these indices. The S&P 500 Total Return Index is a market cap weighted index of 500 widely held stocks often used as a proxy for the overall U.S. equity market. The Fund consists of securities which vary significantly from those in the benchmark indices. Accordingly, comparing results shown to those of such indices may be of limited use.
Statements herein that reflect projections or expectations of the future financial or economic performance of the Fund are forward-looking statements. Such “forward-looking” statements are based on various assumptions, which may not prove to be correct. Accordingly, there can be no assurance that such assumptions and statements will accurately predict future events or the Fund’s actual performance. No representation or warranty can be given so that the estimates, opinions, or assumptions made herein will prove to be accurate. Any projections and forward-looking statements included herein should be considered speculative and are qualified in their entirety by the information and risks disclosed in the Fund’s Private Placement Memorandum. Actual results for any period may or may not approximate such forward-looking statements. You are advised to consult with your own independent tax and business advisors concerning the validity and reasonableness of any factual, accounting and tax assumptions. No representations or warranties whatsoever are made by the Fund, the General Partner, or any other person or entity as to the future profitability of the Fund or the results of making an investment in the Fund. Past performance is not a guarantee of future results.
The funds described herein are unregistered private investment funds commonly called “hedge funds” (each, a “Private Fund”). Private Funds, depending upon their investment objectives and strategies, may invest and trade in a variety of different markets, strategies and instruments (including securities and derivatives) and are NOT subject to the same regulatory requirements as mutual funds, including requirements to provide certain periodic and standardized pricing and valuation information to investors.
There are substantial risks in investing in a Private Fund. Prospective investors should note that:
-
A Private Fund represents a speculative investment and involves a high degree of risk.
-
Investors must have the financial ability, sophistication/experience, and willingness to bear the risks of an investment in a Private Fund.
-
An investor could lose all or a substantial portion of his/her/its investment.
-
An investment in a Private Fund is not suitable for all investors and should be discretionary capital set aside strictly for speculative purposes.
-
Only qualified eligible investors may invest in a Private Fund.
-
A Private Fund’s prospectus or offering documents are not reviewed or approved by federal or state regulators and its privately placed interests are not federally, or state registered.
-
An investment in a Private Fund may be illiquid and there are significant restrictions on transferring or redeeming interests in a Private Fund.
-
There is no recognized secondary market for an investor’s interest in a Private Fund and none is expected to develop.
-
A Private Fund may have little or no operating history or performance and may use performance information which may not reflect actual trading of the Private Fund and should be reviewed carefully.
-
Investors should not place undue reliance on hypothetical, pro forma or predecessor performance.
-
A Private Fund’s manager/advisor has total trading authority over a Private Fund.
-
The death or disability of a key person, or their departure, may have a material adverse effect on a Private Fund.
-
A Private Fund may use a single manager/advisor or employ a single strategy, which could mean a lack of diversification and higher risk.
-
A Private Fund may involve a complex tax structure, which should be reviewed carefully, and may involve structures or strategies that may cause delays in important financial and tax information being sent to investors.
-
A Private Fund’s fees and expenses, which may be substantial regardless of any positive return, will offset such Private Fund’s trading profits.
-
If a Private Fund’s investments are not successful or are not sufficiently successful, these payments and expenses may, over a period, significantly reduce or deplete the net asset value of the Private Fund. A Private Fund and its managers/advisors and their affiliates may be subject to various potential and actual conflicts of interest.
-
A Private Fund may employ investment techniques or measures aimed at reducing the risk of loss which may not be successful or fully successful.
-
A Private Fund may employ leverage, including involving derivatives. Leverage presents specialized risks.
-
The more leverage used, the more likely a substantial change in value may occur, either up or down.
The above summary is not a complete list of the risks, tax considerations and other important disclosures involved in investing in a Private Fund and is subject to the more complete disclosures in such Private Fund’s offering documents, which must be reviewed carefully prior to making an investment.
Eaglestone Capital Management LLC is an independent investment advisory firm based in Bronxville, New York. Additional information about Eaglestone Capital Management LLC and its associated persons (including Form ADV) is available on the SEC’s website at www.adviserinfo.sec.gov. You can search this site by a unique identifying number, known as a CRD number. The CRD number for Eaglestone Capital Management LLC is 297958.