Eaglestone Capital


NVIDIA vs. the Engineers
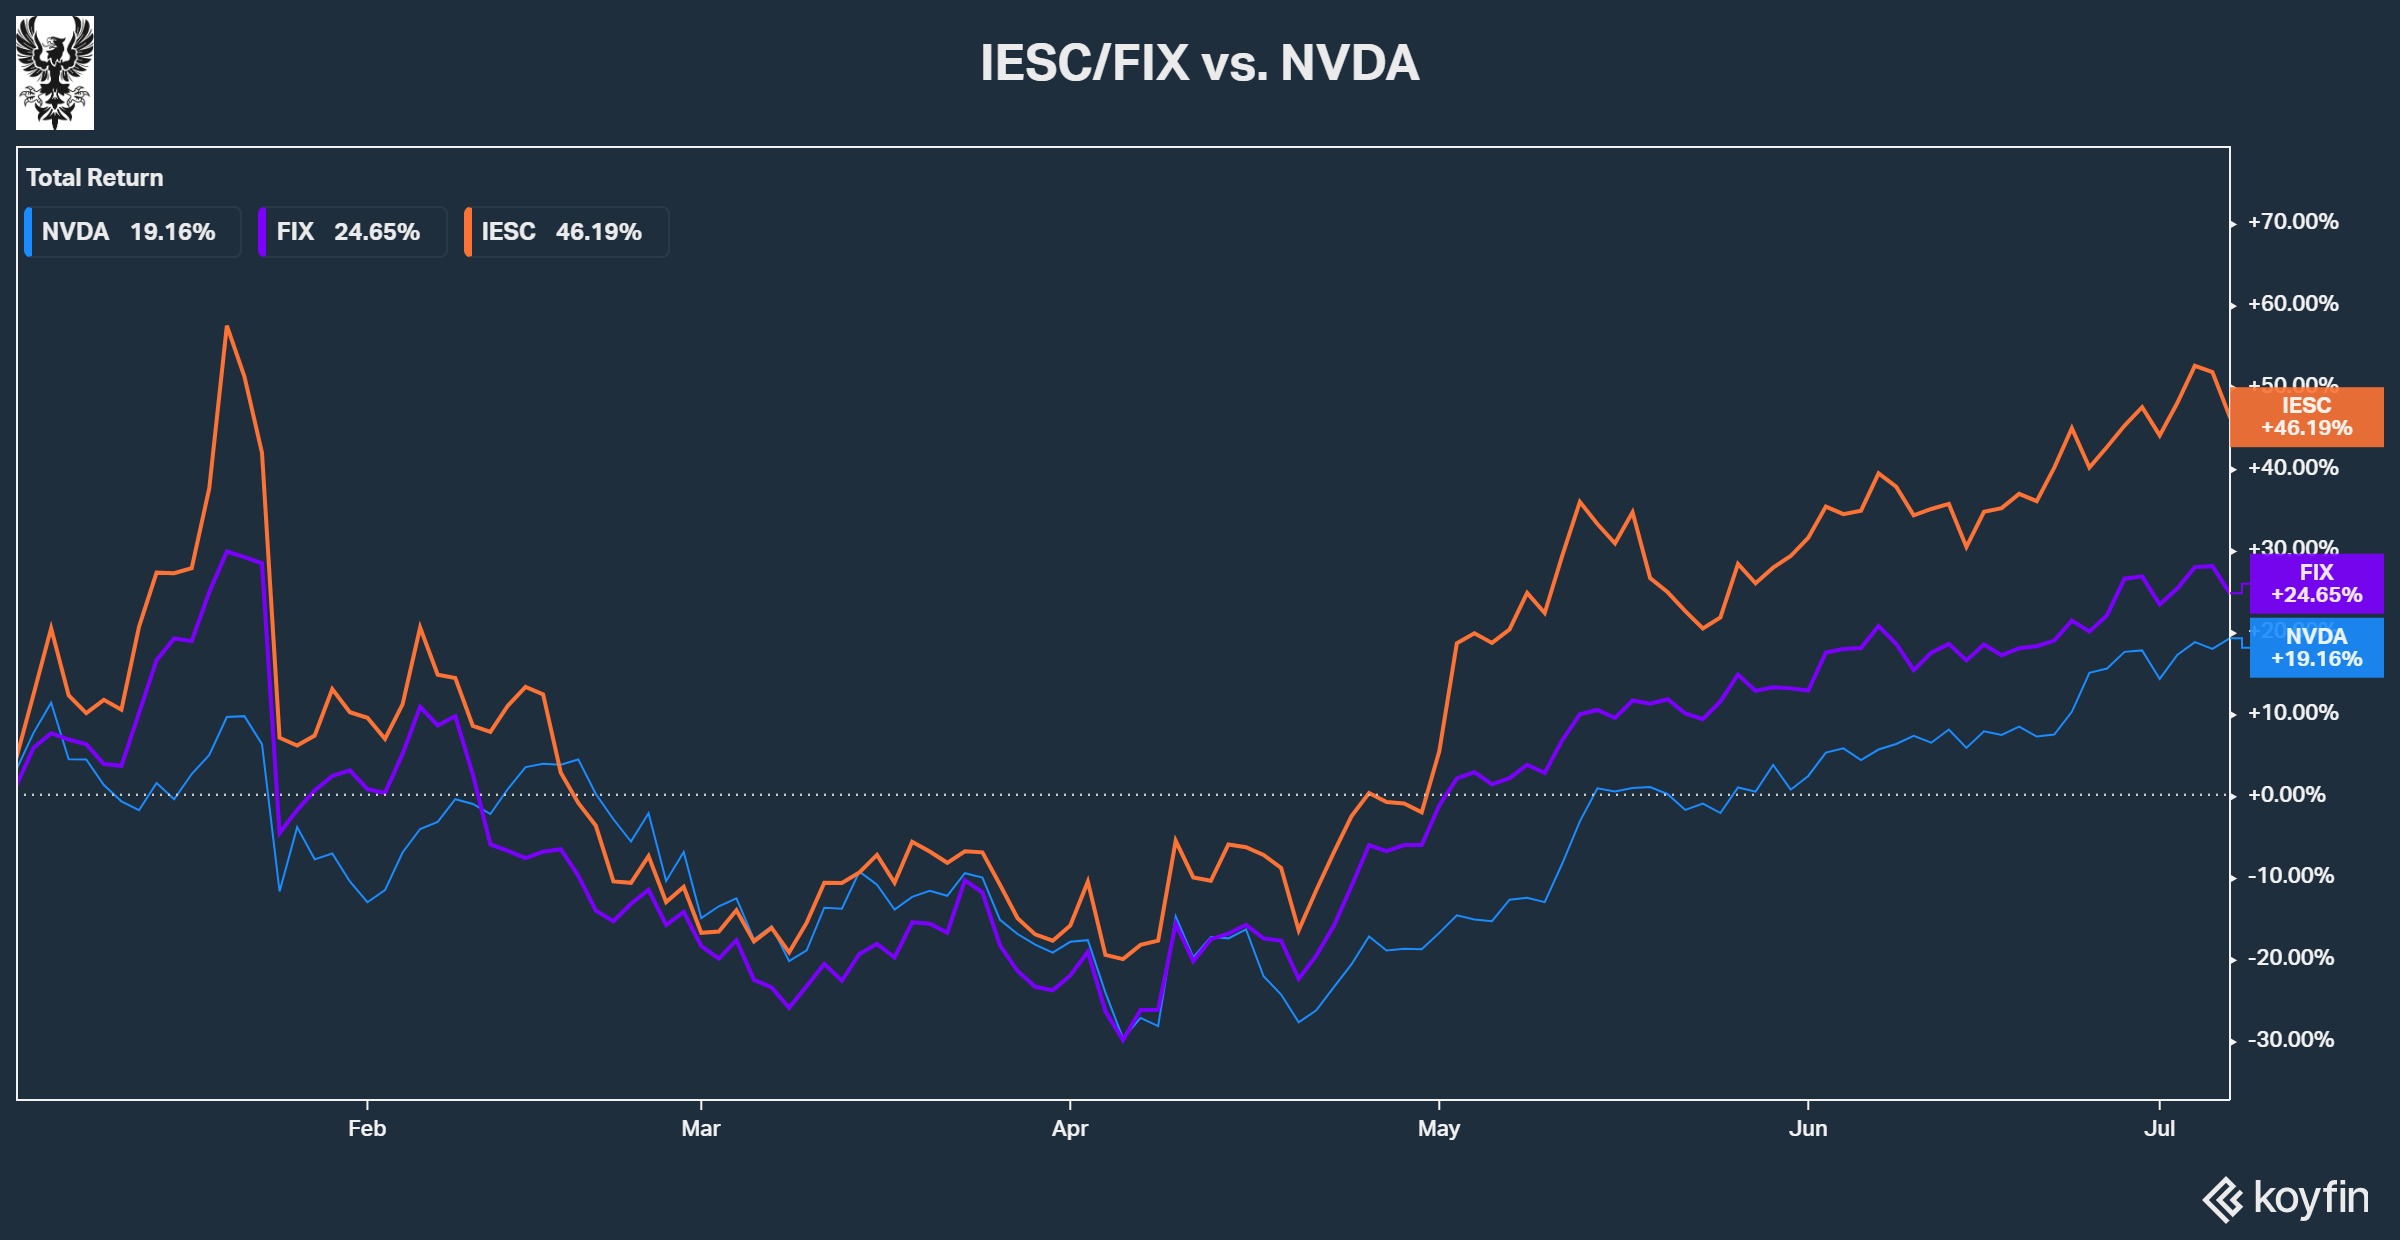
Stock performance of IES Holdings (IESC), Comfort Systems (FIX) and NVDA YTD 2025


Are the GLD Bugs Crazy ?!
GLD Bug in Action
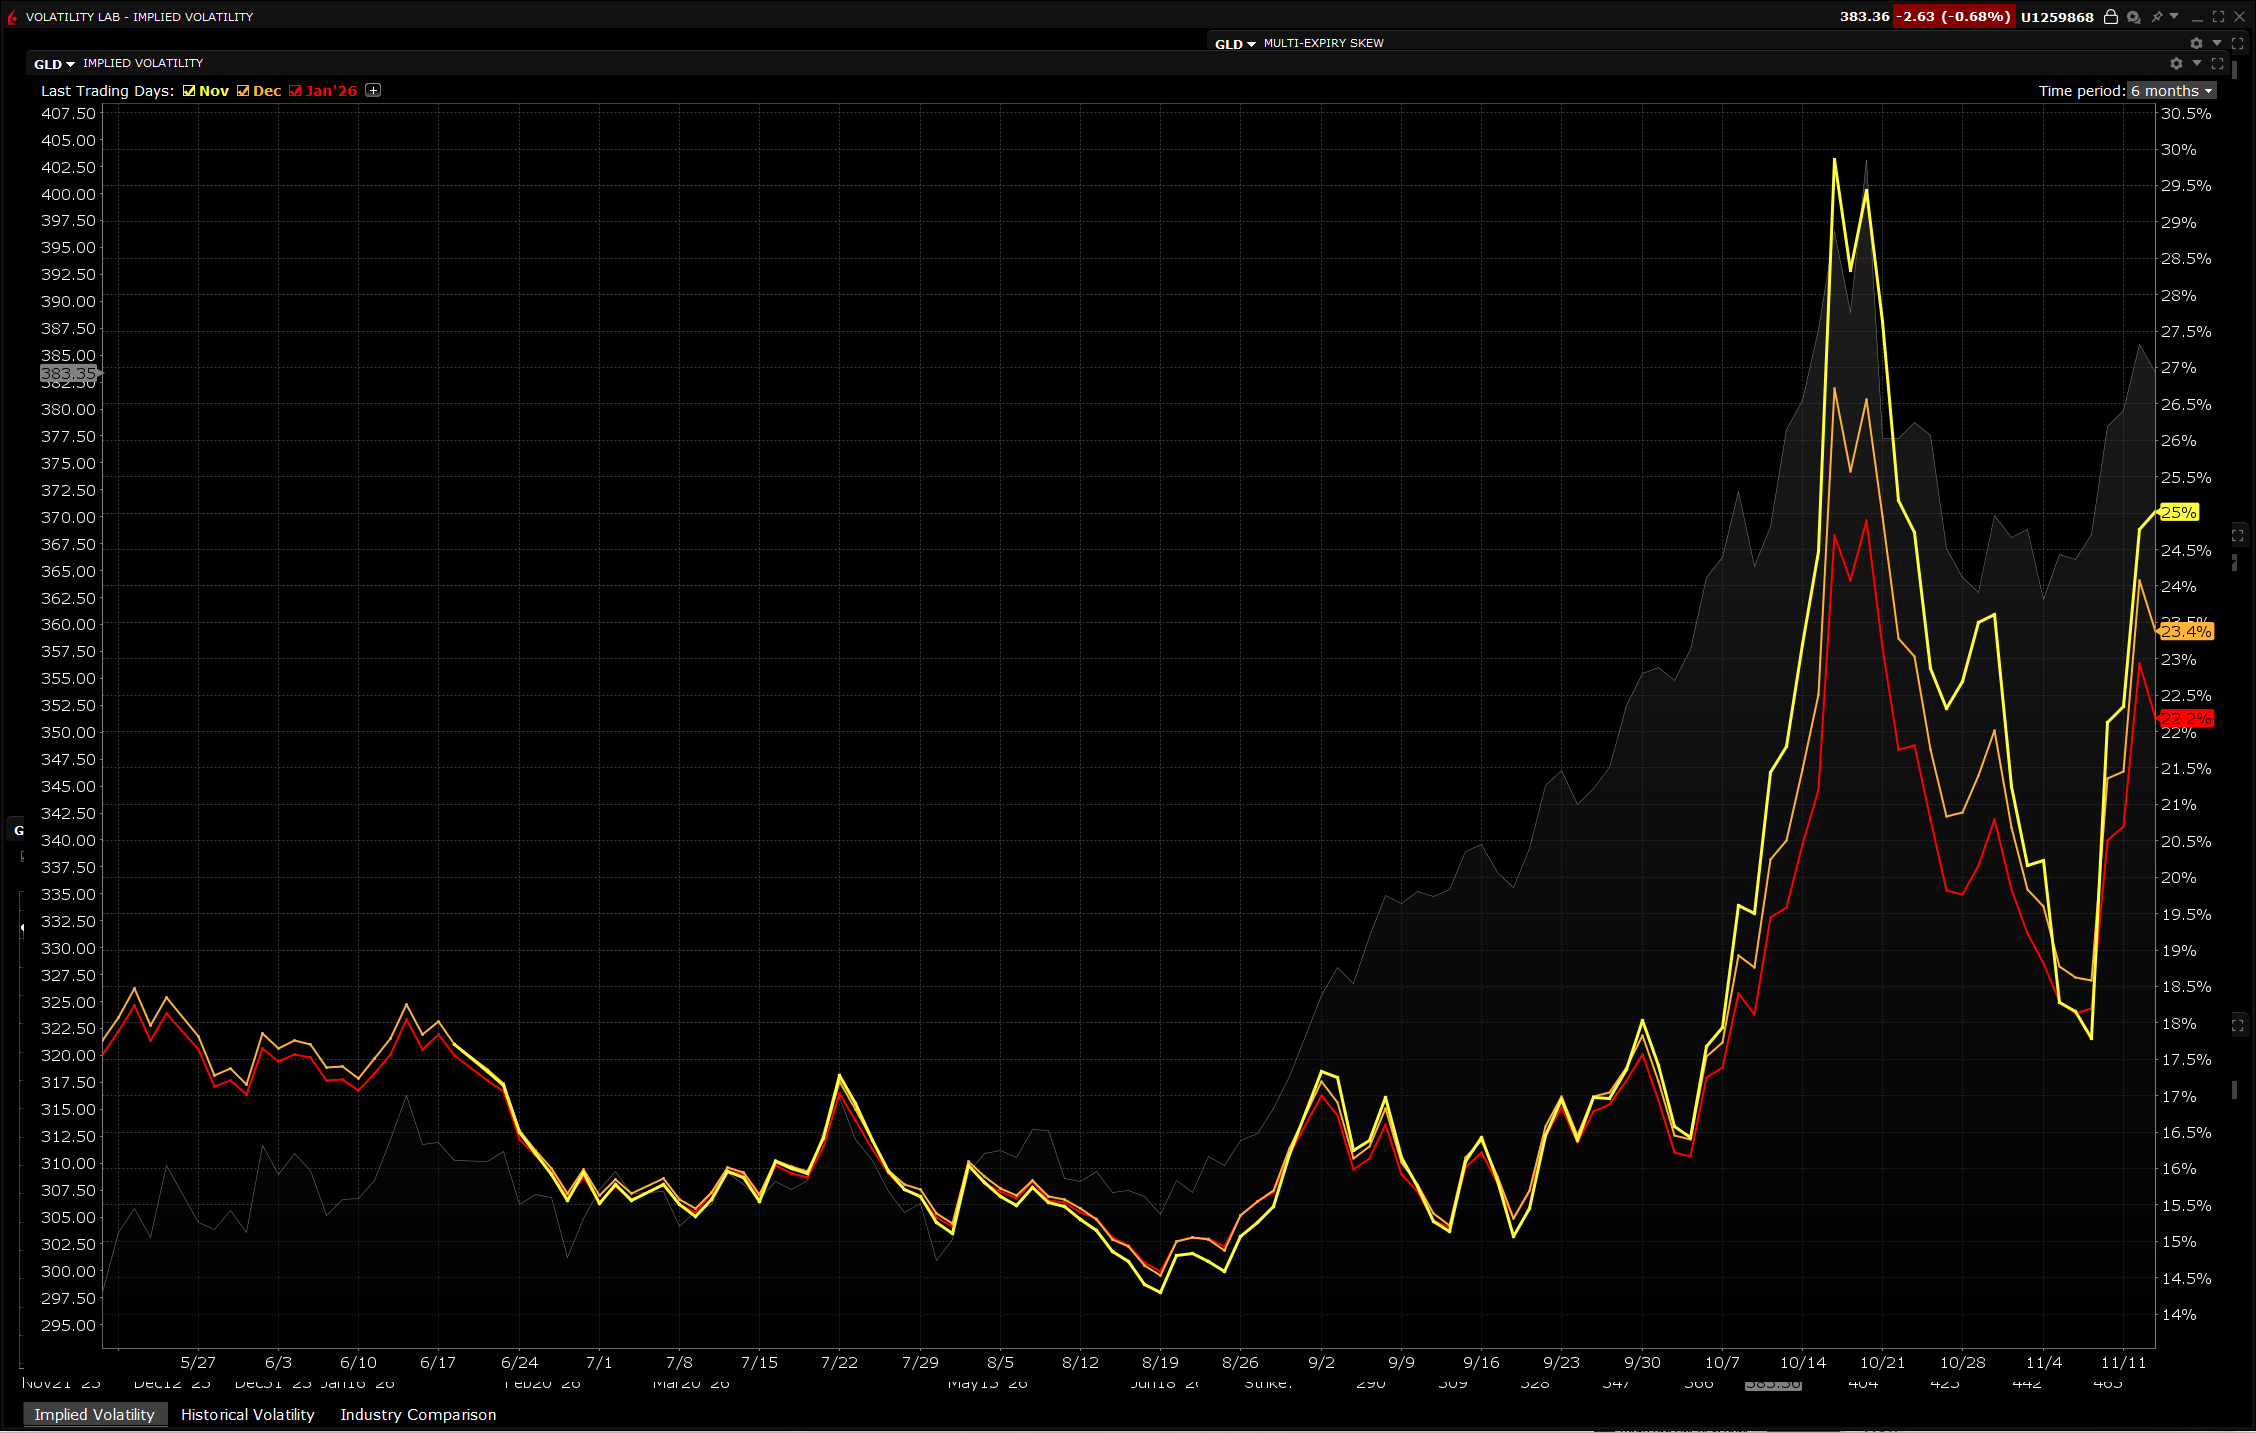
Cohorts of Implied GLD Volatility
Scrolling through LinkedIn the classic GLD bear post goes something like this:
1) GLD’s implied volatility has spiked this year (see monthly cohorts of implied volatility below)
2) Volatility always mean reverts
3) Therefore GLD’s price will decline as implied volatility mean reverts
HOWEVER- Consider the following (here’s why GLD bug’s might NOT be CRAZY):
1) GLD has a Beta of 0.14, implying that ONLY 14% of GLD’s moves are explained by moves in the S&P 500 (with a Beta of 1)
2) Hence 86% of GLD’s volatility is idiosyncratic and independent of the market moves
3) SO while GLD’s implied volatility might suggest “RISKY” the low correlation with the market MAKES GLD an excellent diversifier, actually REDUCING a portfolio’s overall volatility
Real-World Historical Behavior Patterns when SPY Crashes:
2008 Financial Crisis:
• SPY: -37%
• GLD: +5%
• Beta would predict: -5.2% (0.14 × -37%)
• Actual: Positive (safe haven bid)
2020 COVID Crash (Feb-Mar):
• SPY: -34% (peak to trough)
• GLD: -12% initially, then +25% by year-end
• Beta would predict: -4.8%
• Actual: Initial correlation, then massive divergence
2022 Bear Market:
• SPY: -18%
• GLD: -0.3%
• Beta would predict: -2.5%
• Actual: Nearly flat (held value)
Feb 19th, 2025 – April 7th, 2025 (Tariff Tantrum):
• SPY: -19%
• GLD: +1%
• Beta would predict: -2.7%
• Actual: Outperformed! (De-dollarization + inflation fears)
TODAY: November 13th, 2025 (Gov’t Re-Opened):
• SPY: -1.2%
• GLD: -0.008%
• Beta would predict: -0.17%
• Actual: Slight outperformance – GLD declined less than predicted
CONCLUSION: MAYBE THE GLD BUGS ARE ON TO SOMETHING -

Nigel Wright
RIP Nigel Wright
A personal remembrance of integrity, mentorship, and kindness.
A few weeks ago in early October 2025 my wife Mandy asked me if I had heard about the death of Nigel Wright. She knew Nigel from our time working in London as he often dropped by for a visit with Canadian friends.
“No! What happened?” I exclaimed – my mind raced and then some very old but very vivid memories surfaced, and, in a flash, I was back in an Edmonton board room on a dark, cold day in January 1996…
Our deal team (led by Nigel) was exhausted – diligence and negotiations that began in October had continued through December, keeping us from our families throughout the holidays … but a deal was on the table, Onex was about to purchase Vencap Equities Alberta and we were keen to wrap things up and get back to Toronto.
At the last minute, a surprise dispute arose over $5000 of expenses. Nigel wasn’t having it – f the drama – he got up, put his credit card on the table and said:
“Guys, let me cover it – my team wants to get home.”
Then my mind flashed back to my last day at Davies, Ward & Beck – it was late spring 1996 and I had just found out that unfortunately I was not getting a full-time offer. Dejected, I slunk off to my favorite coffee shop across from First Canadian Place to lick my wounds and contemplate my future.
Out of the blue Nigel shows up, pulls up a chair and apologizes:
“Fred – don’t take this the wrong way – you’ve got a lot of potential and I can see great things in your future. Stay in touch – I’ve got some ideas for you.”
I thanked him, (curious how he tracked me down), but didn’t think much of it—people often make promises that go nowhere.
Weeks later, I was in London working for a British law firm – a location change that I thought would help get my career back on track.
One afternoon that summer, I returned from a meeting to find a message to ‘call Nigel Wright in Toronto’ – pleasantly surprised I returned the call to see what was going on:
“Fred, I’ve been looking around and there’s a partner at McMillan Binch that’s building up a securities group and he wants to hire you. I gave him a great reference and I’m sure that you’ll do great things if you accept.”
Wow, I thought – Nigel does what he says. He didn’t just offer kind words; he opened a door and restored my confidence.
Much later, in 2014 when Nigel was in the Prime Minister’s office and the Mike Duffy scandal broke I recall thinking back to that Edmonton boardroom – the similarities were uncanny – Nigel sticking out his neck to help his team, thinking the parties were arguing over a trivial matter.
Nigel was a man of rare integrity who followed through on his promises and genuinely invested in the potential of others. Rest in Peace Nigel – your life was cut far too short, but your impact endures.

3Q2025 Investor Letter
Eaglestone Capital 3Q2025 Investor Letter

October 4th, 2025
“The illusion that we understand the past fosters overconfidence in our ability to predict the future.”
— Daniel Kahneman, Thinking Fast & Slow
Dear Partner:
Eaglestone Capital Partners LP (“Eaglestone Partners” or the “Fund”) enjoyed a solid 3Q2025, generating returns for the typical limited partner of 15.6% and 26.5% for the periods ending 3Q2025 and YTD 30 September 2025.

Long positions in Comfort Systems USA (FIX), IES Holdings (IESC) and Tesla (TSLA) were the largest contributors (in that order) to the Fund’s positive performance while long positions in BellRing Brands (BRBR), Kinsale Capital (KNSL) and Coinbase (COIN) were the largest detractors from performance (in that order).
It was great to see the most significant portion of Eaglestone Capital’s most recent quarterly returns coming from a couple of the largest positions in the portfolio: FIX and IESC, confirming my belief that these companies were worthy of such large portfolio weightings. FIX and IESC were both researched in early FY2024 (for more details, see FY2024 investor letter for IESC and the 1Q2025 investor letter for FIX) as I became further convinced that AI work-loads (or tokens generated) would continue to grow and generally drive datacenter construction. What I am less certain about is whether (1) Nvidia and its partners will continue to dominate or (2) AMD, other chip designers, perhaps even specialized ASICs, customer owned tooling designs (etc) will start to eat into Nvidia’s massive market share.
One key difference between FIX and IESC was Eaglestone’s position sizing heading into the now infamous “Liberation Day” on April 2nd, 2025 - the date when Trump announced sweeping tariffs (the stock market swooned as did the long bond – by May 10th, 2025 the 10 year US treasury yield hit 4.4% up from 4.17% just prior to the April 2nd, 2025 tariff announcement). FIX’s stock price had run up in 1Q2024 (by March 3rd, 2024 it was already trading at $330/share or 26x EV/EBIT) before Eaglestone had enough “comfort” to put on a full position. Meanwhile, in March 2024 IESC was still around $100/share or 12x EV/EBIT so at that price it made sense to build a large IESC position. Skip forward to 1Q2025 and both IESC and FIX were seeing share price hits as first the DeepSeek scare and then trade tensions hit - IESC fell to $165/share and FIX was all the way back to $316/share, providing Eaglestone with a new opening to purchase the FIX shares – and purchase Eaglestone did.
3Q2025 also had its share of mistakes, the most glaring was Eaglestone’s over-confidence in BellRing Brands (BRBR). From previous letters I’ve described some of the attractive accounting-based metrics of BRBR - high returns on invested capital and return on capital employed ROCE (hint: they out-source manufacturing!), and attractive growth – and we were aware of the potential storm clouds following the first quarter 2025 earnings call:
“BellRing Brands sells primarily to Costco, Sam’s Club and Amazon and therefore concerns arise when there are differences between consumption (Premier Protein RTD shake sales by the channel retailers) and BRBR’s net sales to these retailers. Consumption of Premier Protein RTD shakes for the 2Q2025 grew 24.9% YoY (higher than net sales growth of 21.7%). .On the [earnings] call, management disclosed 16% consumption growth in April 2025 and for 3Q2025 management projected consumption growth of 15%-18% but due to the Club channel inventory reduction, only single digit sales growth.”
— Eaglestone 1Q2025 Investor Letter
Well, the following quarter’s earnings call provided more of the same – worsening inventory turns as the big box retailers forced BRBR to hold and pay for inventory, inability to pass through costs increases (whether from tariffs or not isn’t the point) and an inability for BRBR management to provide guidance beyond a quarter (did they really know what was going on with their brand?) – classic signs that BRBR wasn’t in control and in-fact Costco et al were in charge and treating BRBR as their private-label brand.
So we exited the position, and once again marveled at the power of Costco: high velocity, low margin and trust-based loyalty. Yes, Charlie we should have bought some Costco.
Regards,
66 Palmer Avenue, Suite 32B, Bronxville, NY 10708
914.202.8811
www.eaglestonecapital.net
Eaglestone Capital’s Investment Philosophy
Eaglestone Capital is an independent registered investment adviser (RIA) based in Bronxville, NY, founded by Fred Stupart. It serves as the sole investment adviser to Eaglestone Capital Partners LP (the “Fund”), which targets 15% absolute annual returns to its limited partners through investments in daily-liquid securities. The Fund primarily invests in U.S. equities and may employ leverage to boost returns. The Fund offers an alternative to the array of index funds, annuities, and other common products available to individuals seeking a secure retirement.
Eaglestone Capital views the U.S. economy as sui generis —truly one of a kind: unparalleled, irreplaceable, and impossible to replicate. Consequently, applying insights drawn from U.S. data to other markets can yield misleading conclusions. Furthermore, the foundation of continued U.S. economic growth—encompassing employment gains, real estate appreciation, and other asset expansion—is its dynamic, highly competitive private sector, exemplified by many publicly traded firms. As a result, investing in high-quality U.S. companies that uphold shareholder rights is vital to any robust investment strategy. Furthermore, Eaglestone Capital appreciates the opportunities available outside the U.S. but prefers to invest with U.S. companies with foreign subsidiaries as the best means of taking advantage of such non-U.S. opportunities.
Eaglestone Capital also believes in the individual’s power to independently analyze and choose their path to economic freedom. Today’s investors are well-informed and enjoy abundant investment choices. Although we applaud rising participation in U.S. equity markets, the growing concentration of a few companies in major equity indexes could dampen equity index returns if margins or topline growth at those companies decline and investors become more selective.
Eaglestone Capital believes that intelligence, effort, and patience yield the best results. While this should be self-evident, many index fund philosophies conflict with it. When Jack Bogle introduced the S&P 500 index fund in 1976, he offered a new, low-cost product that helped keep large asset managers honest. Yet what is initially a clever innovation often becomes overused. We may soon see many index funds lag behind AI-empowered active managers able to allocate capital more flexibly.
Eaglestone Capital oversees a portfolio of 20–30 liquid equities, each run by leadership teams possessing a “fiduciary gene”—managers who respect shareholder rights and strive to develop innovative, capital-efficient businesses that deliver strong returns to owners. Eaglestone Capital recognizes that risks and rewards vary widely across the U.S. economy, welcoming multiple industries and business models into its portfolio. Some firms have attained scale and efficiency and thus generate high margins and robust returns on capital. Others, analogous to partially finished real estate developments, still have room to grow margins and returns on capital and hence during this “development phase” they might appear to have very high valuations based on traditional EV/EBIT or P/E multiples.
Finally, Eaglestone Capital acknowledges the U.S. equity market’s potential volatility, as shifting momentum can strongly influence investor behavior. However, Eaglestone Capital does not equate volatility with risk – in fact, volatility is a key benefit available only to public market investors seeking high absolute returns. Sometimes “the market” decides that it wants to sell stocks – Eaglestone Capital respects the market’s momentum, appreciates its power and will wait for an appropriate time to exercise any judgement.
General Disclaimer
By accepting this investment letter, you agree that you will not divulge any information contained herein to any other party. This letter and its contents are confidential and proprietary information of the Fund and any reproduction of this information, in whole or in part, without the prior written consent of the Fund is prohibited.
The information contained in this letter reflects the opinions and projections of Eaglestone Capital Management LLC (the "General Partner") and its affiliates as of the date of publication, which are subject to change without notice at any time after the date of issue. All information provided is for informational purposes only and should not be deemed as investment advice or a recommendation to purchase or sell any specific security.
Statements herein that reflect projections or expectations of the future financial or economic performance of the Fund are forward-looking statements. Such "forward-looking" statements are based on various assumptions, which may not prove to be correct. Accordingly, there can be no assurance that such assumptions and statements will accurately predict future events or the Fund's actual performance.
The funds described herein are unregistered private investment funds commonly called "hedge funds" (each, a "Private Fund"). Private Funds, depending upon their investment objectives and strategies, may invest and trade in a variety of different markets, strategies and instruments (including securities and derivatives) and are NOT subject to the same regulatory requirements as mutual funds, including requirements to provide certain periodic and standardized pricing and valuation information to investors. There are substantial risks in investing in a Private Fund.
Prospective investors should note that:
- A Private Fund represents a speculative investment and involves a high degree of risk.
- Investors must have the financial ability, sophistication/experience, and willingness to bear the risks of an investment in a Private Fund.
- An investor could lose all or a substantial portion of his/her/its investment.
- An investment in a Private Fund is not suitable for all investors and should be discretionary capital set aside strictly for speculative purposes.
- Only qualified eligible investors may invest in a Private Fund.
- A Private Fund's prospectus or offering documents are not reviewed or approved by federal or state regulators and its privately placed interests are not federally, or state registered.
- An investment in a Private Fund may be illiquid and there are significant restrictions on transferring or redeeming interests in a Private Fund.
- There is no recognized secondary market for an investor's interest in a Private Fund and none is expected to develop.
- A Private Fund's manager/advisor has total trading authority over a Private Fund.
- A Private Fund's fees and expenses, which may be substantial regardless of any positive return, will offset such Private Fund's trading profits.
- A Private Fund and its managers/advisors and their affiliates may be subject to various potential and actual conflicts of interest.
- A Private Fund may employ leverage, including involving derivatives. Leverage presents specialized risks.
The above summary is not a complete list of the risks, tax considerations and other important disclosures involved in investing in a Private Fund and is subject to the more complete disclosures in such Private Fund's offering documents, which must be reviewed carefully prior to making an investment.
Eaglestone Capital Management LLC is an independent investment advisory firm based in Bronxville, New York. Additional information about Eaglestone Capital Management LLC and its associated persons (including Form ADV) is available on the SEC’s website at www.adviserinfo.sec.gov. You can search this site by a unique identifying number, known as a CRD number. The CRD number for Eaglestone Capital Management LLC is 297958.

2Q2025 Investor Letter
Eaglestone’s 2Q2025 Investor Letter
July 5th, 2025
“If you want to improve, be content to be thought foolish and stupid.” — Epictetus, Enchiridion, 13
Dear Partner:
Eaglestone Capital Partners LP (“Eaglestone Partners” or the “Fund”) enjoyed a “snap-back” in 2Q2025, generating returns for the typical limited partner for the periods ending 2Q2025 and YTD 30 June 2025 as follows:

Long positions in Comfort Systems USA (FIX), IES Holdings (IESC), Amazon (AMZN) and Netflix (NFLX) were the largest contributors (in that order) to the Fund’s positive performance while long positions in BellRing Brands (BRBR), Arch Capital Group (ACGL) and ExlService Holdings (EXLS) were the largest detractors from performance (in that order).
This quarter, we dedicated significant research to the burgeoning stablecoin market, a key potential growth driver for the digital economy. Below, we share our findings and explain the trillion-dollar opportunity that firms like Circle (NYSE: CRCL) and its partner Coinbase (NASDAQ: COIN) are pursuing.
Thesis: The Trillion-Dollar Opportunity in Digital Payments
Foundation: Why Stablecoins Matter
A key part of our investing process is looking for new industry growth drivers that could provide tailwinds to existing firms and spark the creation of new entrants. Sorting the signal from the noise requires patience, but the potential rewards are substantial. This is why we spent the past quarter conducting a deep dive into Circle Internet Group (NYSE: CRCL), its partnership with Coinbase Global (NASDAQ: COIN), and the digital payments market they are set to revolutionize.
The Dollar’s Digital Future
The US dollar (USD) is the world’s undisputed reserve currency, underpinning the global economy. It accounts for 26% of world GDP but plays an outsized role in finance, comprising: (a) 58% of disclosed global foreign reserves (b) 88% of all global foreign exchange (FX) transactions.
This results in nearly $6.6 trillion in USD trading every day in the FX markets alone. In contrast, the entire market for US dollar-pegged stablecoins is less than $250 billion. This gap highlights the immense potential for growth.
Two Models for Digital Dollars: USDC vs. USDT
Regulatory focus from the EU and U.S. is increasingly shaping the stablecoin market. Lawmakers want stablecoins to solve the “payments problem” and avoid “banking and credit” functions like money creation through lending. This has created a fundamental divide in the market, best understood by comparing the two dominant players, USDC and USDT.
Their differences echo a concept from the 1930s known as the Chicago Plan, which proposed separating the monetary (payment) and credit (lending) functions of the banking system.
USDC: A True “Payment Money” System
USDC’s structure aligns with the “payment money” or “100% reserve” philosophy. Its model is built on stability and transparency.
-
Full-Reserve Principle: USDC is backed 1:1 by cash and short-term U.S. government securities held at regulated U.S. financial institutions. This prioritizes capital preservation and ensures every USDC is redeemable for one dollar.
-
Separation of Functions: Circle, the issuer, operates as a money transmitter, not a lender. It does not use reserve assets for risky lending, separating the payment function from credit risk.
-
Transparency and Regulation: USDC operates with monthly attestations from a “Big Four” accounting firm, aligning with its strategy of regulatory compliance.
USDT: A Hybrid “Lending Money” System
In contrast, USDT (Tether) operates a model that more closely resembles a fractional-reserve system, where payment and credit functions are combined.
-
Commingling of Functions: While holding safe assets, Tether’s reserves also include riskier, yield-generating assets like secured loans, corporate bonds, and other digital assets. This means Tether is explicitly engaging in credit creation with the assets backing its stablecoin.
-
Profit from Lending: Tether’s business model generates billions in income from the interest earned on its reserve portfolio—a classic banking function that involves taking on credit and duration risk.
-
Opacity and Risk: The commingling of functions and its offshore regulatory status expose USDT holders to the creditworthiness of Tether’s borrowers and the market risk of its investments.
In short, USDC is engineered to be a frictionless payment rail, while USDT is structured more like a yield-generating investment product.
Putting Programmable Money to Work
The ultimate vision is for USDC to become a foundational layer for the financial internet, much like VISA/MasterCard are for traditional commerce. As Patrick Collison testified before the House Financial Services Committee in March 2025:
“At Stripe, our history with and thinking about digital currencies has evolved. While we pioneered Bitcoin support in 2014 but paused it due to limited demand, we are now seeing meaningful business interest in stablecoins as the underlying technology has matured. To give a sense of the demand: when Stripe launched stablecoin pay-ins in April of 2024, we saw more volume in stablecoin payments over the first week than we saw with Bitcoin over a year and a half.”
This is possible because USDC is “programmable money”—a smart contract that allows for automated and conditional transactions. Major players are now building systems on top of this feature, creating a multi-layered ecosystem.
-
The Merchant Experience: Seamless Crypto Payments
-
Who: Shopify, Stripe, and Coinbase.
-
How it Works: A customer on a Shopify site can pay with USDC. Stripe’s interface connects to their crypto wallet, and a smart contract automates the transfer. Stripe then instantly converts the USDC to fiat currency for the merchant.
-
The Magic: The merchant never has to touch cryptocurrency. They simply receive dollars in their bank account, making the experience identical to a credit card payment from their perspective.
-
-
The Spending Experience: A Crypto-Linked Debit Card
-
Who: Stripe and Visa.
-
How it Works: This model functions like a debit card. A user holds a balance of USDC in a digital wallet linked to a Visa-branded card. They can use this card anywhere Visa is accepted.
-
The Magic: When a purchase is made, a smart contract is triggered. It automatically deducts the corresponding amount of USDC from the user’s wallet, converts it to fiat in real-time, and settles the payment through the Visa network. The on-chain digital asset is seamlessly spent in the physical world.
-
-
The Future – A True On-Chain Credit Card
-
Who: This model is anticipated to involve a three-way partnership between a stablecoin issuer (like Circle), a payment network (like Visa), and a regulated credit institution (a bank).
-
How it is Expected to Work: A partner bank would underwrite the user and issue a traditional line of credit. The cardholder could then spend against this credit line. At the end of the billing cycle, smart contracts could allow the user to settle their balance directly from their USDC holdings, potentially automating payments and rewards in a way not possible with traditional systems.
-
The Magic: This would represent the holy grail of on-chain finance: the fusion of traditional credit underwriting with the programmable, efficient, and transparent nature of stablecoins. It would allow users to benefit from the credit facilities of the established financial system while using digital assets as the ultimate settlement layer, creating a true “credit card” experience.
-
Last Words on COIN and CRCL
Finally, how does the USDC partnership between COIN and CRCL work? They formed a partnership whereby CRCL issues and manages the yield-earning reserves (“payment base”) backing USDC while COIN agrees to support USDC’s growth by making it widely accessible and integrate USDC across multiple blockchains, products and services. In exchange, COIN receives roughly 50% of the payment base in respect of USDC held on third party platforms and 100% of the payment base in respect of USDC held on COIN’s platform. As of 1Q2025, that amounted to roughly $1.2 billion in annualized revenues for COIN.
Regards,
Eaglestone Capital Management LLC
66 Palmer Avenue, Suite 32B, Bronxville, NY 10708
914.202.8811
Eaglestone Capital Management LLC prepared this letter. NAV Fund Services, our administrator, is responsible for the distribution of this information and not its content.
Eaglestone Capital’s Investment Philosophy
Eaglestone Capital is an independent registered investment adviser (RIA) based in Bronxville, NY, founded by Fred Stupart. It serves as the sole investment adviser to Eaglestone Capital Partners LP (the “Fund”), which targets 15% absolute annual returns to its limited partners through investments in daily-liquid securities. The Fund primarily invests in U.S. equities and may employ leverage to boost returns. The Fund offers an alternative to the array of index funds, annuities, and other common products available to individuals seeking a secure retirement.
Eaglestone Capital views the U.S. economy as sui generis—truly one of a kind: unparalleled, irreplaceable, and impossible to replicate. Consequently, applying insights drawn from U.S. data to other markets can yield misleading conclusions. Furthermore, the foundation of continued U.S. economic growth—encompassing employment gains, real estate appreciation, and other asset expansion—is its dynamic, highly competitive private sector, exemplified by many publicly traded firms. As a result, investing in high-quality U.S. companies that uphold shareholder rights is vital to any robust investment strategy. Furthermore, Eaglestone Capital appreciates the opportunities available outside the U.S. but prefers to invest with U.S. companies with foreign subsidiaries as the best means of taking advantage of such non-U.S. opportunities.
Eaglestone Capital also believes in the individual’s power to independently analyze and choose their path to economic freedom. Today’s investors are well-informed and enjoy abundant investment choices. Although we applaud rising participation in U.S. equity markets, the growing concentration of a few companies in major equity indexes could dampen equity index returns if margins or topline growth at those companies decline and investors become more selective.
Eaglestone Capital believes that intelligence, effort, and patience yield the best results. While this should be self-evident, many index fund philosophies conflict with it. When Jack Bogle introduced the S&P 500 index fund in 1976, he offered a new, low-cost product that helped keep large asset managers honest. Yet what is initially a clever innovation often becomes overused. We may soon see many index funds lag behind AI-empowered active managers able to allocate capital more flexibly.
Eaglestone Capital oversees a portfolio of 20–30 liquid equities, each run by leadership teams possessing a “fiduciary gene”—managers who respect shareholder rights and strive to develop innovative, capital-efficient businesses that deliver strong returns to owners. Eaglestone Capital recognizes that risks and rewards vary widely across the U.S. economy, welcoming multiple industries and business models into its portfolio. Some firms have attained scale and efficiency and thus generate high margins and robust returns on capital. Others, analogous to partially finished real estate developments, still have room to grow margins and returns on capital and hence during this “development phase” they might appear to have very high valuations based on traditional EV/EBIT or P/E multiples.
Finally, Eaglestone Capital acknowledges the U.S. equity market’s potential volatility, as shifting momentum can strongly influence investor behavior. However, Eaglestone Capital does not equate volatility with risk – in fact, volatility is a key benefit available only to public market investors seeking high absolute returns. Sometimes “the market” decides that it wants to sell stocks – Eaglestone Capital respects the market’s momentum, appreciates its power and will wait for an appropriate time to exercise any judgement.
General Disclaimer
By accepting this investment letter, you agree that you will not divulge any information contained herein to any other party. This letter and its contents are confidential and proprietary information of the Fund and any reproduction of this information, in whole or in part, without the prior written consent of the Fund is prohibited.
The information contained in this letter reflects the opinions and projections of Eaglestone Capital Management LLC (the “General Partner”) and its affiliates as of the date of publication, which are subject to change without notice at any time after the date of issue. All information provided is for informational purposes only and should not be deemed as investment advice or a recommendation to purchase or sell any specific security.
All performance results are based on the net asset value of the Fund. Net performance results are presented net of management fees, brokerage commissions, administrative expenses, and accrued performance allocation, as indicated, and include the reinvestment of all dividends, interest, and capital gains. The performance results represent Fund-level returns and are not an estimate of any specific investor’s actual performance, which may be materially different from such performance depending on numerous factors.
The market indices appearing in this letter have been selected for the purpose of comparing the performance of an investment in the Fund with certain well-known equity benchmarks. Statistical data regarding the indices has been obtained from public sources and the returns are calculated assuming all dividends are reinvested. The indices are not subject to any of the fees or expenses to which the funds are subject and may involve significantly less risk than the Fund. The Fund is not restricted to investing in those securities which comprise these indices, its performance may or may not correlate to these indices, and it should not be considered a proxy for these indices. The S&P 500 Total Return Index is a market cap weighted index of 500 widely held stocks often used as a proxy for the overall U.S. equity market. The Fund consists of securities which vary significantly from those in the benchmark indices. Accordingly, comparing results shown to those of such indices may be of limited use.
Statements herein that reflect projections or expectations of the future financial or economic performance of the Fund are forward-looking statements. Such “forward-looking” statements are based on various assumptions, which may not prove to be correct. Accordingly, there can be no assurance that such assumptions and statements will accurately predict future events or the Fund’s actual performance. No representation or warranty can be given so that the estimates, opinions, or assumptions made herein will prove to be accurate. Any projections and forward-looking statements included herein should be considered speculative and are qualified in their entirety by the information and risks disclosed in the Fund’s Private Placement Memorandum. Actual results for any period may or may not approximate such forward-looking statements. You are advised to consult with your own independent tax and business advisors concerning the validity and reasonableness of any factual, accounting and tax assumptions. No representations or warranties whatsoever are made by the Fund, the General Partner, or any other person or entity as to the future profitability of the Fund or the results of making an investment in the Fund. Past performance is not a guarantee of future results.
The funds described herein are unregistered private investment funds commonly called “hedge funds” (each, a “Private Fund”). Private Funds, depending upon their investment objectives and strategies, may invest and trade in a variety of different markets, strategies and instruments (including securities and derivatives) and are NOT subject to the same regulatory requirements as mutual funds, including requirements to provide certain periodic and standardized pricing and valuation information to investors.
There are substantial risks in investing in a Private Fund. Prospective investors should note that:
-
A Private Fund represents a speculative investment and involves a high degree of risk.
-
Investors must have the financial ability, sophistication/experience, and willingness to bear the risks of an investment in a Private Fund.
-
An investor could lose all or a substantial portion of his/her/its investment.
-
An investment in a Private Fund is not suitable for all investors and should be discretionary capital set aside strictly for speculative purposes.
-
Only qualified eligible investors may invest in a Private Fund.
-
A Private Fund’s prospectus or offering documents are not reviewed or approved by federal or state regulators and its privately placed interests are not federally, or state registered.
-
An investment in a Private Fund may be illiquid and there are significant restrictions on transferring or redeeming interests in a Private Fund.
-
There is no recognized secondary market for an investor’s interest in a Private Fund and none is expected to develop.
-
A Private Fund may have little or no operating history or performance and may use performance information which may not reflect actual trading of the Private Fund and should be reviewed carefully.
-
Investors should not place undue reliance on hypothetical, pro forma or predecessor performance.
-
A Private Fund’s manager/advisor has total trading authority over a Private Fund.
-
The death or disability of a key person, or their departure, may have a material adverse effect on a Private Fund.
-
A Private Fund may use a single manager/advisor or employ a single strategy, which could mean a lack of diversification and higher risk.
-
A Private Fund may involve a complex tax structure, which should be reviewed carefully, and may involve structures or strategies that may cause delays in important financial and tax information being sent to investors.
-
A Private Fund’s fees and expenses, which may be substantial regardless of any positive return, will offset such Private Fund’s trading profits.
-
If a Private Fund’s investments are not successful or are not sufficiently successful, these payments and expenses may, over a period, significantly reduce or deplete the net asset value of the Private Fund.
-
A Private Fund and its managers/advisors and their affiliates may be subject to various potential and actual conflicts of interest.
-
A Private Fund may employ investment techniques or measures aimed at reducing the risk of loss which may not be successful or fully successful.
-
A Private Fund may employ leverage, including involving derivatives. Leverage presents specialized risks.
-
The more leverage used, the more likely a substantial change in value may occur, either up or down.
The above summary is not a complete list of the risks, tax considerations and other important disclosures involved in investing in a Private Fund and is subject to the more complete disclosures in such Private Fund’s offering documents, which must be reviewed carefully prior to making an investment.
Eaglestone Capital Management LLC is an independent investment advisory firm based in Bronxville, New York. Additional information about Eaglestone Capital Management LLC and its associated persons (including Form ADV) is available on the SEC’s website at www.adviserinfo.sec.gov. You can search this site by a unique identifying number, known as a CRD number. The CRD number for Eaglestone Capital Management LLC is 297958.

Great Father’s Day Advice from JD Rockefeller - or is it?!
Great Father’s Day Advice from JD Rockefeller - or is it?!

Statue of Atlas located in courtyard of the International Building at Rockefeller Center in Midtown Manhattan
Greetings,
It’s Fathers Day 2025 - I’m reminded of a book I once saw on Amazon, supposedly personal letters written by JD Rockefeller to his son John - over 100 years ago entitled "38 Letters from JD Rockefeller to his Son” (on Amazon 38 Letters from JD Rockefeller ) that import some blunt yet helpful wisdom. So I pull up the book on audible to remind myself about what caught my attention earlier.
Letter 7 apparently written on November 19th, 1899 contains some gems: “Optimistic people will see opportunity in suffering and pessimistic people will see suffering in opportunity. Son, remember the formula of success that I believe in: “dream plus failure plus challenge equals success” and further in the same letter: “Failure is a learning experience - you can either turn it into a tombstone or a stepping stone.”
This letter from 1899 also references the famous (but I thought apocryphal) quote from Thomas Edison: “I have not failed 10,000 times, I just invented 10,000 unworkable methods.” and attributes the quote to a newspaper interview with Edison 10 years earlier (so around 1889).
My curiosity aroused, I’m thinking “that’s interesting, so maybe Edison really did say this” - but I also recall it was supposedly about his work on the battery, not the lightbulb and the majority of the battery experiments took place in the early 1900s I thought.
So I pull up Gemini to find additional details on when & where Edison supposedly provided his “10,000 ways” quote, referencing this book of “JD Rockefeller” letters and bam!
It turns out that this book of supposed letters from JD Rockefeller to his son is fictional. To quote Gemini: “Thank you for providing the source of the quote. This has allowed for a definitive clarification. The book you cited, "38 Letters from J.D. Rockefeller to His Son," is widely considered by historians and archival experts to be a work of fiction and not a collection of authentic letters from John D. Rockefeller.
Investigations into the book's origins have revealed several critical inconsistencies:
• No Archival Record: The Rockefeller Archive Center, the official repository for the family's historical documents, has confirmed that it has no record of the letters featured in the book.
• Factual Inaccuracies: The text contains significant historical errors. For instance, a letter supposedly written in the early 20th century mentions "Citibank," a name that was not in use until 1976.
• Questionable Provenance: The book first appeared in Chinese and was later translated into English. It is highly improbable that genuine letters from an American industrialist to his son would surface in this manner without any prior record in English.
Despite its questionable provenance, the advice in the book “38 Letters from JD Rockefeller to his son” is pretty good -
Happy Fathers Day!

Beware Single Stock Bets
Placing concentrated or single stock bets in the market can really get your heart racing but a recent study highlights the risks of losing money on a single stock bet.
Placing concentrated or single stock bets in the market can really get your heart racing but a recent study highlights the risks of losing money on a single stock bet.
A recently published study “Underperformance of Concentrated Stock Positions” finds that many high-net-worth investors hold concentrated positions in single stocks, which may constitute 10-20% or more of their total portfolio assets. While most investors recognize that lack of diversification increases the volatility of portfolio returns, they may not understand that concentrated stock positions usually contribute negatively to portfolio returns. Since 1926, the median ten-year return on individual U.S. stocks relative to the broad equity market is –7.9%, underperforming by 0.82% per year and 54.6% of individual stocks had negative market-adjusted returns.
2024 Year End Investor Letter
Eaglestone Capital’s 2024 Investor Letter
Eaglestone Capital achieved impressive results in FY2024
January 31st, 2025
Dear Partner:
Eaglestone Capital Partners LP (“Eaglestone Partners” or the “Fund”) enjoyed a profitable FY2024, generating returns for the typical limited partner as follows:

Long positions in Berkshire Hathaway (BRK.B), Tesla (TSLA), Amazon (AMZN), Bellring Brands (BRBR) and Arista Networks (ANET) were the largest contributors (in that order) to the Fund’s performance while long positions in Fox Factory Holdings (FOXF), ASML Holding NV (ASML), Installed Building Products (IBP) and IES Holdings (IESC) were the largest detractors from performance (in that order).
You cannot find “^SP500 TR Levered” in the public markets – it’s comprised of the ^SP500 Total Return” leveraged by a mix of 40% debt and 60% equity to better compare it with the levered returns of Eaglestone Partners. So for example, if the ^SP500 TR index held $100 worth of securities that appreciated 25% to $125 over FY2024, we assumed that the index financed that portfolio with 40% debt and 60% equity (hence 100/60 or 167% gross) and therefore generated an equity return of roughly $25/$60 (less a 5% cost of debt) or roughly 38% for the same period.
While Berkshire Hathaway (BRK.B), Tesla (TSLA) and Amazon (AMZN) are well known public companies, BellRing Brands (BRBR) might be new to some people.
BellRing Brands Case Study
BellRing Brands (BRBR) is a consumer-packaged goods (CPG) firm spun out of Post Holdings in March 2022. BRBR operates two brands - Premier Protein (85.5% of sales) and Dymatize (12.5% of sales) with ready to drink (RTD) protein shakes constituting the majority of Premier Protein sales.
Premier Protein Brand
-
Market leading ~23% share in the RTD convenient nutrition category which includes protein shakes and meal replacement drinks; competitors include Ensure and Muscle Milk.
-
Product line: RTD shakes (14 flavors) with 30g protein, 1g sugar, 160 calories.
-
Positioned to benefit from health & wellness trends and GLP-1 therapies, which drive muscle-preservation demand.
-
Primary consumers: older millennials and Gen X dieters seeking convenient high-protein products.
-
New, fast growing category: 90% of Premier Protein growth is from either (1) new users from outside the category or (2) increased consumption from existing users (remaining 10% of user growth comes from brand switching).
Growth Drivers
-
Elevated protein demand from GLP-1 users seeking to maintain muscle mass.
-
RTD shake household penetration (~45%) remains below bars (54%) and energy drinks (75%).
-
Premier Protein household penetration of 19% is well below leading energy drink brands with over 50% household penetration.
-
Enhanced marketing and promotional activity planned for Premier Protein in FY2025.
Eaglestone Partners investment thesis for BellRing Brands (BRBR) is simple: continue to hold the investment position so long as the business profitably grows its core Premier Protein brand from 19% household penetration towards the 50% household penetration target with an expectation that larger CPG companies will eventually become interested in an acquisition to capture BRBR’s brand name and growth prospects for themselves while allowing BRBR to better amortize marketing and distribution costs over the acquiror’s existing brand portfolio.
So which companies might purchase a fast growing $10 billion market capitalization CPG company like BRBR for a premium?
Here’s a partial list of companies selected based on their > $10 billion market capitalization, strong distribution networks and potential interest in another CPG brand. I’ve also listed their existing brand portfolios in relevant sectors such as food, beverages, consumer health, and pharmaceuticals. Interestingly, some retailers stock Premier Protein alongside the medicinal products (vitamins, nutritional supplements) while others stock it with the regular beverages.
| Potential Acquiror | Market Capitalization | Core Businesses | Relevant Brands |
|---|---|---|---|
| Johnson & Johnson | $343.4 billion | Pharmaceuticals, medical devices, and consumer health products | Splenda (sweetener), Benecol (cholesterol-lowering products) |
| The Procter & Gamble Company | $389 billion | Consumer goods, health care, and personal care products | Metamucil (fiber supplement), Align (probiotic supplement) |
| The Coca-Cola Company | $270 billion | Beverages | Fairlife (protein-enhanced milk), Core Power (protein shakes) |
| PepsiCo, Inc. | $210 billion | Food and beverages | Gatorade (sports drinks), Muscle Milk (protein products) |
| Abbott Laboratories | $200.3 billion | Health care products, including supplements | Ensure (nutritional shakes), Glucerna (diabetic nutritional shakes) |
| Nestlé S.A. | $180 billion | Food and beverage conglomerate | Boost (nutritional drinks), Nesquik, Carnation Breakfast Essentials |
| Unilever plc | $151.6 billion | Consumer goods, including food and beverages | SlimFast (meal replacement shakes), Knorr, Hellmann’s |
| Anheuser-Busch InBev SA/NV | $103.4 billion | Beverages, primarily alcoholic | Budweiser, Corona, Michelob Ultra |
| Mondelez International, Inc. | $76 billion | Snacks and beverages | BelVita (breakfast biscuits), Enjoy Life (allergy-friendly snacks) |
| GSK plc | $71.7 billion | Pharmaceuticals and consumer health products | Horlicks (malted milk drink) (acquired from Unilever in 2020) |
| Danone S.A. | $45.1 billion | Dairy and plant-based products, early life nutrition, medical nutrition | Danone (dairy products), Nutricia (medical nutrition) |
| Reckitt Benckiser Group plc | $41.25 billion | Consumer health, hygiene, and home products | Enfamil (infant formula), Airborne (supplements) |
| The Kraft Heinz Company | $36.7 billion | Food and beverage products | Oscar Mayer (meats), Planters (nuts) |
| General Mills, Inc. | $35.2 billion | Consumer foods | Yoplait (yogurt), Nature Valley (snack bars) |
| Kellanova | $27.5 billion | Cereals and convenience foods | Special K (protein meal bars and shakes), Kashi (health foods) |
| Bayer AG | $19.8 billion | Pharmaceuticals and consumer health products | One A Day (vitamins), Flintstones (children’s vitamins) |
| Hormel Foods Corporation | $17.6 billion | Food products | Vital Cuisine, MedPass, (sold CytoSport to Pepsi) |
| Conagra Brands, Inc. | $17.5 billion | Packaged foods | Slim Jim (meat snacks), Healthy Choice (frozen meals) |
| Mars, Incorporated | Private | Confectionery, pet care, and other food products | Snickers Protein (protein bars), Mars Protein (protein powders) |
(Market capitalization figures are approximate as of December 31, 2024, based on publicly available financial data. )
While Eaglestone Partners sold Fox Factory Holdings (FOXF) early in FY2024 after earnings failed to live up to the promised turnaround and the stock price subsequently declined 10% below our purchase price in early FY2024, Eaglestone Partners still holds positions in ASML Holding NV (ASML), Installed Building Products (IBP) and IES Holdings (IESC).
IES Holdings (IESC) Investment Case Study

A key driver behind Eaglestone Capital’s investment in IES Holdings (IESC) – a Houston, TX based engineering, procurement and construction (EPC) firm – are the massive investments being made in the construction of U.S. data centers by the large hyper-scalers. Interestingly, the firm hasn’t attracted any Wall Street research, partially because its unique ownership structure has removed the classic “agency problem” and allowed management to focus on equity returns. IESC is run by Mr. Jeff Gendell – he has been CEO since October 1, 2020 and previously beginning November 2016, he served as Chairman of the Board. Jeff is the founder and managing member of Tontine Associates, L.L.C. (Tontine) which is also the majority shareholder of the Company (they own 54.77% of the outstanding shares). Tontine exercises control through the same class of shares that Eaglestone Partners owns in the public markets and hence we feel there is an alignment of interests. Eaglestone Partner’s investment in IESC allows the partnership to profit from (1) excitement in AI without having to worry about which LLM, hardware or even hyper-scaler will emerge as the winner of this new era (2) continued growth in on-line retailing and the build-out of additional distribution centers and (3) any future recovery in new-build residential housing.
After studying the AI supply chain, Eaglestone Partners decided that the EPC firms occupied an interesting position. Once you had some exposure to ASML, TSMC, your favorite hyper-scalers and perhaps a key infrastructure product (like Arista switches), where else could you invest with some degree of confidence? The EPC firms occupy a unique position – hyper-scalers spending billions on silicon chips, networking equipment and power solutions for new data centers require an EPC who is capable, reliable and efficient. We found that EPC firms focusing on skilled electrical, HVAC, plumbing (cooling) and power generation were in huge demand and often their ability to attract upfront or generous payment terms for in-demand projects have allowed them to reduce their debt and improve working capital dynamics. IESC has been careful to balance its growth through a mix of organic (as witnessed through increases in working capital) and acquisitions and in the process kept down its leverage.

What are Eaglestone Partners value realization plans? While there are many larger public EPC firms that would be interested in acquiring IESC its unclear that such an exit is necessary to achieve our forecasted returns.
AI CapEx Fears: Lessons from the DotCom Era - Cisco Systems Case Study
I often look back to see if I can learn from past mistakes. Given recent excitement around the Chinese LLM “DeepSeek” and the subsequent $450 billion decline in the market capitalization of AI “story stock” Nvidia over the week ending January 31, 2025, perhaps a case study on another hardware-focused tech stock, Cisco Systems, will provide “signals” to help better understand today’s AI-enhanced stock market.
CEO John Chambers began the Cisco Systems (“Cisco”) FY 2000 annual report as follows:
“Over the next two decades, the Internet economy will bring about more dramatic changes in the way we work, live, play and learn than we witnessed during the last 200 years of the Industrial Revolution.”
Sound familiar? While I believe this prediction regarding the internet was indeed correct, the stock market capitalization of Cisco fell about 85% from $550 billion as of March 31, 2000 to around $83 billion by the end of October 2001. Cisco was the 4th largest company in the S&P 500 as of December 31, 2000 representing about 2.4% of the S&P 500 market capitalization.
Cisco Systems focused on convincing corporate customers to spend money on Cisco’s networking equipment such as routers and switches with the expectation that better and faster internet access would increase that customer’s existing productivity and lower their cost structure. As the FY 2000 annual report explains:
“There is a direct correlation between the strength of this economy and the unprecedented productivity gains we are witnessing today. We refer to this phenomenon as the “Network Effect” which is the result of information technology becoming networked and Internet applications being used to re-engineer business processes. Companies that understand the Network Effect can gain competitive advantage by quickly detecting and responding to situations such as real-time changes in customer demand.”
Acquisitions formed a key component of Cisco’s business model. From FY1993 to FY2000, they purchased 65 businesses – unfortunately as part of the process, they increased their share count by over 30%. Cisco’s quarterly earnings releases focused on the tremendous acquisition-fueled revenue and adjusted earnings growth while ignoring their growing costs. For example, the FY2000 earnings release focused on the 55% growth in topline revenues and 47% growth in adjusted EPS while ignoring the fact that GAAP EPS only grew at half that pace – expenses were growing faster than revenues.
There were other red flags: at its peak in FY2000 Cisco was trading at 29x revenues, 203x earnings and 305x operating cash flow less capex but high valuations hadn’t held back Cisco’s share price in the past. Finally, there does appear a curious $1 billion spike in customer accounts receivable (AR) in FY 2000 – in previous years AR remained stable - was this some form of vendor financing that was helping to increase sales?
The S&P 500 Index peaked at 1527 on March 24th, 2000 and after a volatile spring and summer it managed to rise to 1515 on August 28th, 2000 before beginning a slide that didn’t bottom for another two years. Throughout FY 2000 there’s no hint of a slowdown in Cisco’s topline revenues – in fact, Cisco’s major clients didn’t begin to really cut back on their spending (and hence Cisco’s revenues didn’t begin to decline) until the latter half of 2001, well after Cisco’s share price had tumbled 85%.
So let’s continue down the supply chain to better understand Cisco’s clients. Over 50% of Cisco’s sales came from the major global telecom companies who apparently believed that massive investor interest in the internet and mobile telephony was a signal to ‘grow at any cost’. In FY 2000 the largest global telcos were NTT (Japan), AT&T (US), Deutsche Telekom (Germany) and Vodafone (UK).
Several years prior to this time, governments all over the world, led by the US, opened their telecom markets to competition. While causation is unclear, there was a subsequent ‘boom’ in network capacity buildouts, mergers and acquisitions.
For example, after the U.S. congress passed the Telecommunications Act of 1996, over $500 billion dollars of capital flooded in, mostly debt financed, as existing firms and new ones began building massively parallel networks.
However, by FY2000 companies began to realize that there simply wasn’t enough business to go around, and they raced “to gain market share” in a burst of “hypercompetition” and “vicious price wars” that drove down revenues. So much long-distance capacity was added in North America, for example, that no more than two percent was being used by 2002. With the fixed costs of these new networks so high and the marginal costs of sending signals over them so low, it is not a surprise that competition forced prices down to the point where many firms lost the ability to service their debts.
At the same time, the Federal Reserve was relentlessly raising interest rates – from June 30th, 1999 to May 17th, 2000 the Fed raised rates 175bps - from 4.75% on June 30th, 1999 to 6.5% on May 17th, 2000 - even after the equity markets started to decline in March 2000. Interestingly, WorldCom (a darling of that era) saw its stock price peak in June of 1999 after which it attempted to merge with Sprint in October 1999 – fortunately for Sprint the deal was called off due to regulatory concerns in June 2000. WorldCom subsequently began to unravel, finally declaring bankruptcy in July 2002.
So what can we learn from the telecom bust of FY 2000? When your largest companies are spending billions in capex on “exciting” new projects, carefully track the investment returns and follow the money.
AMZN, GOOG, MSFT and META are anticipated to spend a combined $325 billion in capital expenditure over the course of FY2025, a 33% increase over the $244.3 billion spent on capital expenditures in FY2024. Interestingly, this represents a slowdown from the 63% increase in capex spending by these hyper-scalers from FY2023 to FY2024.
Looking back at FY2024, we can observe the trailing returns earned by these businesses on the massive increases in capex spending. As detailed below, we observe that returns on invested capital – “ROIC”: a metric that tracks after tax operating profits divided by net debt plus equity capital – generally held firm despite the 63% year over year increase in capex.
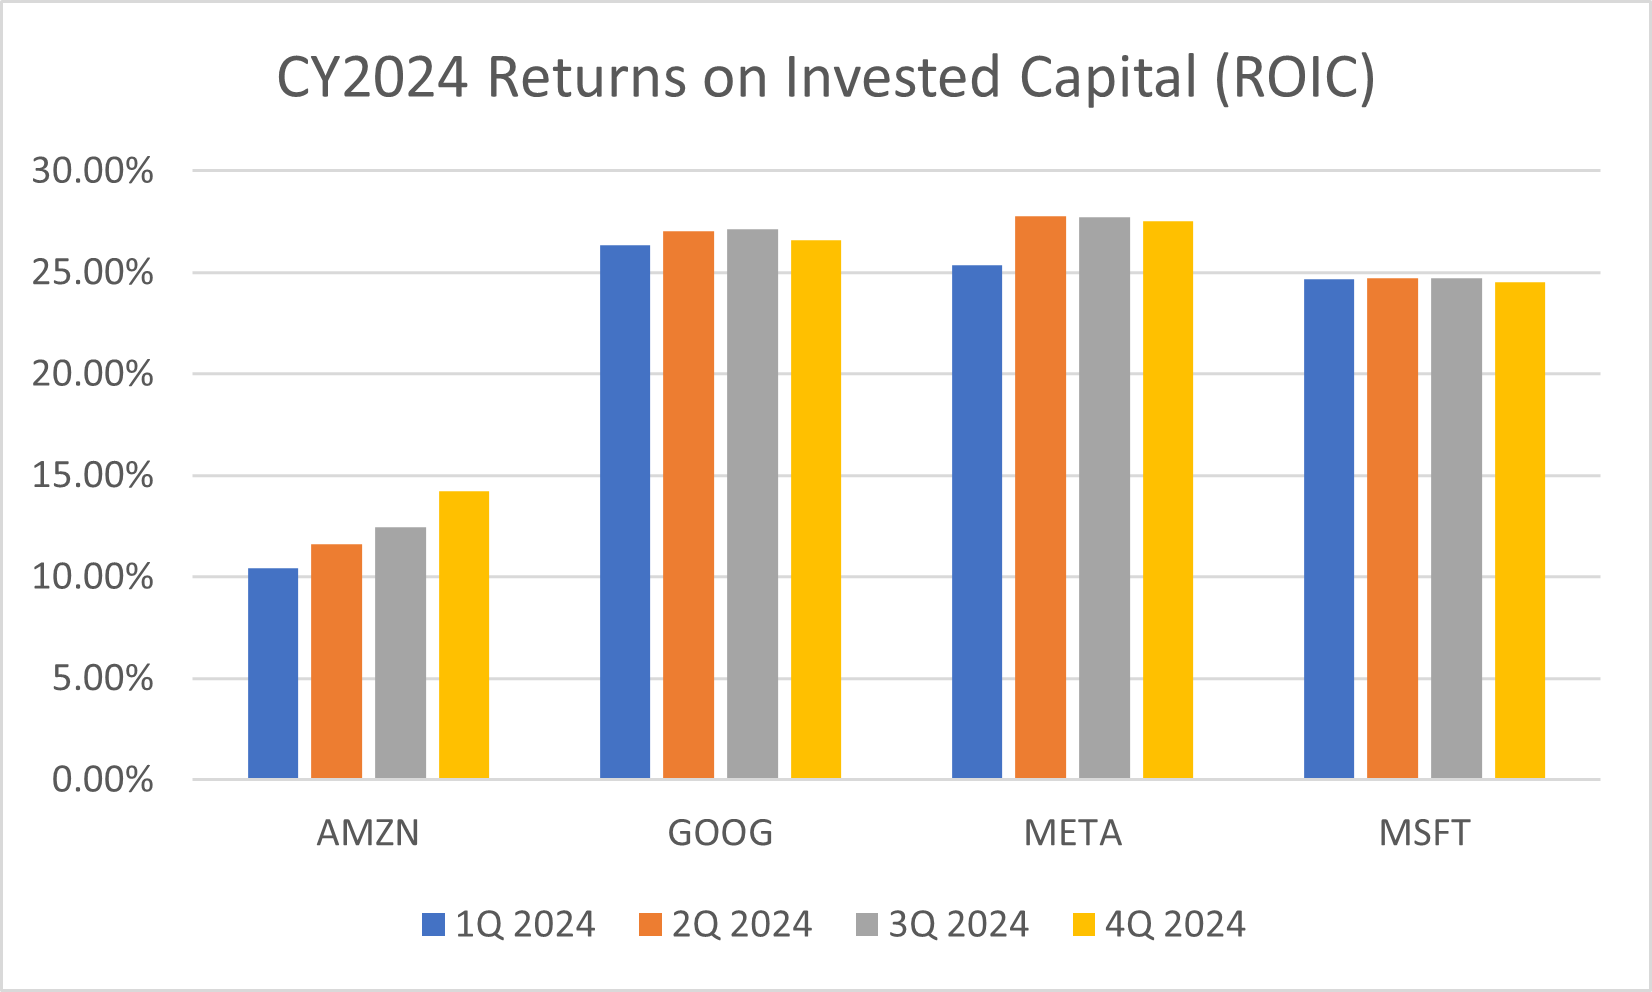
Notice the constant ramp in AMZN’s quarterly ROIC – AMZN’s operating margin of 11% (4Q2024) is greatly enhanced by the growth in their AWS cloud business with a 37% operating margin (4Q2024) while MSFT’s 45% operating margin (4Q2024) is similar to MSFT intelligent cloud’s 42.5% operating margin (4Q2024), GOOG’s 32% operating margin is still higher than GOOG Cloud’s 17.6% operating margin (though it has been rapidly rising) and META’s 42% operating margin (4Q2024) doesn’t include any third party cloud hosting. So for AMZN, increasing its AWS capex is a ‘no brainer’ – AWS is growing much faster and at a margin almost 3x greater than its core business.
Let’s see what FY2025 brings.
Regards,
Eaglestone Capital Management LLC
66 Palmer Avenue, Suite 32B,
Bronxville, NY 10708 914.202.8811
Eaglestone Capital Management LLC prepared this letter. NAV Fund Services, our administrator, is responsible for the distribution of this information and not its content.
Eaglestone Capital’s Investment Philosophy
Eaglestone Capital is an independent registered investment adviser (RIA) based in Bronxville, NY, founded by Fred Stupart. It serves as the sole investment adviser to Eaglestone Capital Partners LP (the “Fund”), which targets 15% absolute annual returns to its limited partners through investments in daily-liquid securities. The Fund primarily invests in U.S. equities and may employ leverage to boost returns. The Fund offers an alternative to the array of index funds, annuities, and other common products available to individuals seeking a secure retirement.
Eaglestone Capital views the U.S. economy as sui generis —truly one of a kind: unparalleled, irreplaceable, and impossible to replicate. Consequently, applying insights drawn from U.S. data to other markets can yield misleading conclusions. Furthermore, the foundation of continued U.S. economic growth—encompassing employment gains, real estate appreciation, and other asset expansion—is its dynamic, highly competitive private sector, exemplified by many publicly traded firms. As a result, investing in high-quality U.S. companies that uphold shareholder rights is vital to any robust investment strategy. Furthermore, Eaglestone Capital appreciates the opportunities available outside the U.S. but prefers to invest with U.S. companies with foreign subsidiaries as the best means of taking advantage of such non-U.S. opportunities.
Eaglestone Capital also believes in the individual’s power to independently analyze and choose their path to economic freedom. Today’s investors are well-informed and enjoy abundant investment choices. Although we applaud rising participation in U.S. equity markets, the growing concentration of a few companies in major equity indexes could dampen equity index returns if margins or topline growth at those companies decline and investors become more selective.
Eaglestone Capital believes that intelligence, effort, and patience yield the best results. While this should be self-evident, many index fund philosophies conflict with it. When Jack Bogle introduced the S&P 500 index fund in 1976, he offered a new, low-cost product that helped keep large asset managers honest. Yet what is initially a clever innovation often becomes overused. We may soon see many index funds lag behind AI-empowered active managers able to allocate capital more flexibly.
Eaglestone Capital oversees a portfolio of 20–30 liquid equities, each run by leadership teams possessing a “fiduciary gene”—managers who respect shareholder rights and strive to develop innovative, capital-efficient businesses that deliver strong returns to owners. Eaglestone Capital recognizes that risks and rewards vary widely across the U.S. economy, welcoming multiple industries and business models into its portfolio. Some firms have attained scale and efficiency and thus generate high margins and robust returns on capital. Others, analogous to partially finished real estate developments, still have room to grow margins and returns on capital and hence during this “development phase” they might appear to have very high valuations based on traditional EV/EBIT or P/E multiples.
Finally, Eaglestone Capital acknowledges the U.S. equity market’s potential volatility, as shifting momentum can strongly influence investor behavior. However, Eaglestone Capital does not equate volatility with risk – in fact, volatility is a key benefit available only to public market investors seeking high absolute returns. Sometimes “the market” decides that it wants to sell stocks – Eaglestone Capital respects the market’s momentum, appreciates its power and will wait for an appropriate time to exercise any judgement.
General Disclaimer
By accepting this investment letter, you agree that you will not divulge any information contained herein to any other party. This letter and its contents are confidential and proprietary information of the Fund and any reproduction of this information, in whole or in part, without the prior written consent of the Fund is prohibited.
The information contained in this letter reflects the opinions and projections of Eaglestone Capital Management LLC (the “General Partner”) and its affiliates as of the date of publication, which are subject to change without notice at any time after the date of issue. All information provided is for informational purposes only and should not be deemed as investment advice or a recommendation to purchase or sell any specific security. All performance results are based on the net asset value of the Fund. Net performance results are presented net of management fees, brokerage commissions, administrative expenses, and accrued performance allocation, as indicated, and include the reinvestment of all dividends, interest, and capital gains. The performance results represent Fund-level returns and are not an estimate of any specific investor’s actual performance, which may be materially different from such performance depending on numerous factors.
The market indices appearing in this letter have been selected for the purpose of comparing the performance of an investment in the Fund with certain well-known equity benchmarks. Statistical data regarding the indices has been obtained from public sources and the returns are calculated assuming all dividends are reinvested. The indices are not subject to any of the fees or expenses to which the funds are subject and may involve significantly less risk than the Fund. The Fund is not restricted to investing in those securities which comprise these indices, its performance may or may not correlate to these indices, and it should not be considered a proxy for these indices. The S&P 500 Total Return Index is a market cap weighted index of 500 widely held stocks often used as a proxy for the overall U.S. equity market. The Fund consists of securities which vary significantly from those in the benchmark indices. Accordingly, comparing results shown to those of such indices may be of limited use.
Statements herein that reflect projections or expectations of the future financial or economic performance of the Fund are forward-looking statements. Such “forward-looking” statements are based on various assumptions, which may not prove to be correct. Accordingly, there can be no assurance that such assumptions and statements will accurately predict future events or the Fund’s actual performance. No representation or warranty can be given so that the estimates, opinions, or assumptions made herein will prove to be accurate. Any projections and forward-looking statements included herein should be considered speculative and are qualified in their entirety by the information and risks disclosed in the Fund’s Private Placement Memorandum. Actual results for any period may or may not approximate such forward-looking statements. You are advised to consult with your own independent tax and business advisors concerning the validity and reasonableness of any factual, accounting and tax assumptions. No representations or warranties whatsoever are made by the Fund, the General Partner, or any other person or entity as to the future profitability of the Fund or the results of making an investment in the Fund. Past performance is not a guarantee of future results.
The funds described herein are unregistered private investment funds commonly called “hedge funds” (each, a “Private Fund”). Private Funds, depending upon their investment objectives and strategies, may invest and trade in a variety of different markets, strategies and instruments (including securities and derivatives) and are NOT subject to the same regulatory requirements as mutual funds, including requirements to provide certain periodic and standardized pricing and valuation information to investors.
There are substantial risks in investing in a Private Fund. Prospective investors should note that:
-
A Private Fund represents a speculative investment and involves a high degree of risk.
-
Investors must have the financial ability, sophistication/experience, and willingness to bear the risks of an investment in a Private Fund.
-
An investor could lose all or a substantial portion of his/her/its investment.
-
An investment in a Private Fund is not suitable for all investors and should be discretionary capital set aside strictly for speculative purposes.
-
Only qualified eligible investors may invest in a Private Fund.
-
A Private Fund’s prospectus or offering documents are not reviewed or approved by federal or state regulators and its privately placed interests are not federally, or state registered.
-
An investment in a Private Fund may be illiquid and there are significant restrictions on transferring or redeeming interests in a Private Fund.
-
There is no recognized secondary market for an investor’s interest in a Private Fund and none is expected to develop.
-
A Private Fund may have little or no operating history or performance and may use performance information which may not reflect actual trading of the Private Fund and should be reviewed carefully.
-
Investors should not place undue reliance on hypothetical, pro forma or predecessor performance.
-
A Private Fund’s manager/advisor has total trading authority over a Private Fund.
-
The death or disability of a key person, or their departure, may have a material adverse effect on a Private Fund.
-
A Private Fund may use a single manager/advisor or employ a single strategy, which could mean a lack of diversification and higher risk.
-
A Private Fund may involve a complex tax structure, which should be reviewed carefully, and may involve structures or strategies that may cause delays in important financial and tax information being sent to investors.
-
A Private Fund’s fees and expenses, which may be substantial regardless of any positive return, will offset such Private Fund’s trading profits.
-
If a Private Fund’s investments are not successful or are not sufficiently successful, these payments and expenses may, over a period, significantly reduce or deplete the net asset value of the Private Fund. A Private Fund and its managers/advisors and their affiliates may be subject to various potential and actual conflicts of interest.
-
A Private Fund may employ investment techniques or measures aimed at reducing the risk of loss which may not be successful or fully successful.
-
A Private Fund may employ leverage, including involving derivatives. Leverage presents specialized risks.
-
The more leverage used, the more likely a substantial change in value may occur, either up or down.
The above summary is not a complete list of the risks, tax considerations and other important disclosures involved in investing in a Private Fund and is subject to the more complete disclosures in such Private Fund’s offering documents, which must be reviewed carefully prior to making an investment.
Eaglestone Capital Management LLC is an independent investment advisory firm based in Bronxville, New York. Additional information about Eaglestone Capital Management LLC and its associated persons (including Form ADV) is available on the SEC’s website at www.adviserinfo.sec.gov. You can search this site by a unique identifying number, known as a CRD number. The CRD number for Eaglestone Capital Management LLC is 297958.
1Q2025 Investor Letter
Eaglestone’s 1Q2025 Investor Letter
May 12th, 2025
“Suffering arises from trying to control what is uncontrollable.” - Epictetus, Enchiridion , 1
Dear Partner:
Eaglestone Capital Partners LP (“Eaglestone Partners” or the “Fund”) indeed suffered through a volatile 1Q2025, generating returns for the typical limited partner for the periods ending 1Q2025 and YTD 12 May 2025 as follows:

Long positions in IES Holdings (IESC), Comfort Systems USA (FIX), W.R. Berkley (WRB) and Netflix (NFLX) were the largest contributors (in that order) to the Fund’s positive performance while long positions in Alphabet (GOOGL), Tesla (TSLA), Amazon (AMZN) and BellRing Brands (BRBR) were the largest detractors from performance (in that order).
With Epictitus in mind let’s re-visit BellRing Brands (BRBR) to update thoughts following the 2Q2025 earnings release (they have a September 30th year end) and the significant stock “sell-off” following.
BellRing Brands Case Study Update
BellRing Brands (BRBR) is a consumer-packaged goods (CPG) firm spun out of Post Holdings in March 2022. BRBR operates two brands - Premier Protein (85.5% of sales) and Dymatize (12.5% of sales) with ready to drink (RTD) protein shakes constituting the majority of Premier Protein sales.
Premier Protein Brand
- Leading market share has increased from 26% share 1Q2025 to 30% share 2Q2025 in the RTD convenient nutrition category which includes protein shakes and meal replacement drinks; the #2 in the market is Core Power (owned by The Coca-Cola Company).
- Product line: RTD shakes (14 flavors) with 30g protein, 1g sugar, 160 calories.
- Positioned to benefit from health & wellness trends and GLP-1 therapies, which drive muscle-preservation demand.
Company-wide net sales of $588mm for 2Q2025 (+19.9% YoY growth) driven by 21.7% YoY net sales growth in Premier Protein RTD shakes comprised of 15.2% growth in volume and 6.5% increase in price/mix. Net sales driven increasingly by price/mix over volume growth has been the trend for the past 4 quarters (see breakout of quarterly price vs. volume growth below).

Growth Drivers
- Elevated protein demand from GLP-1 users seeking to maintain muscle mass.
- According to Cargill’s 2025 Protein Profile, 61% of consumers are increasing their protein intake in 2024, up from 48% in 2019 and by 2030 an estimated 9% of U.S. adults could be using GLP-1s.
What Triggered the Sell-Off
BellRing Brands sells primarily to Costco, Sam’s Club and Amazon and therefore concerns arise when there are differences between consumption (Premier Protein RTD shake sales by the channel retailers) and BRBR’s net sales to these retailers. Consumption of Premier Protein RTD shakes for the 2Q2025 grew 24.9% YoY (higher than net sales growth of 21.7%). Historical consumption numbers are detailed below:

While management’s earnings call disclosed an unusually large decline in Club channel inventory raising investor concerns about unexpected declines in demand, channel consumption trends (see below) appear to be outpacing shipments from BRBR so any fears regarding declining consumer demand appear unwarranted. On the call, management disclosed 16% consumption growth in April 2025 and for 3Q2025 management projected consumption growth of 15%-18% but due to the Club channel inventory reduction , only single digit sales growth. For the full year 2025, management affirmed net sales guidance of $2.26 billion to $2.34 billion (13% - 17% growth) and EBITDA guidance of $470mm - $500mm (7% - 14% growth).

Another area of concern involved the supply chain and cost pressures. While management said that tariff-related input costs (dairy protein is 40% of costs of goods sold and some is purchased from New Zealand and Europe) might impact BRBR later in FY2026, SG&A expenses grew from 14% of net sales in the prior year period to 15.4% of net sales in 2Q2025, driven by higher marketing, consumer advertising and increased distribution & warehousing expenses.
In addition, board chair Robert Vitale who owned ~ 1.465mm shares of BRBR going into the quarter sold off about 25% of his holdings (or about 368,000 shares) in February 2025 spooking some investors.
However, in contrast to these issues, the underlying demand from US consumers for higher protein foods is undeniable and growing. Convenient RTD protein shakes that taste good should see commensurately high demand.
In addition, BRBR has a highly capital efficient business model, employing third party manufacturing and distribution (think The Coca-Cola Company), as demonstrated below by BRBR’s high returns on invested capital.
 BRBR’s returns on capital employed (above 60%) are exceptional. In contrast, the Coca-Cola Company has both lower returns on invested capital and lower returns on capital employed as detailed below. However, notice Coke’s exceptional negative 16.5 days cash cycle indicative of their control over supply chain payment terms.

Eaglestone Partners investment thesis for BellRing Brands (BRBR) is simple: continue to hold the investment position so long as the business profitably grows its core Premier Protein brand from 20.9% household penetration towards the 50% household penetration target with an expectation that larger CPG companies will eventually become interested in an acquisition to capture BRBR’s brand name and growth prospects for themselves while allowing BRBR to better amortize marketing and distribution costs over the acquiror’s existing brand portfolio.
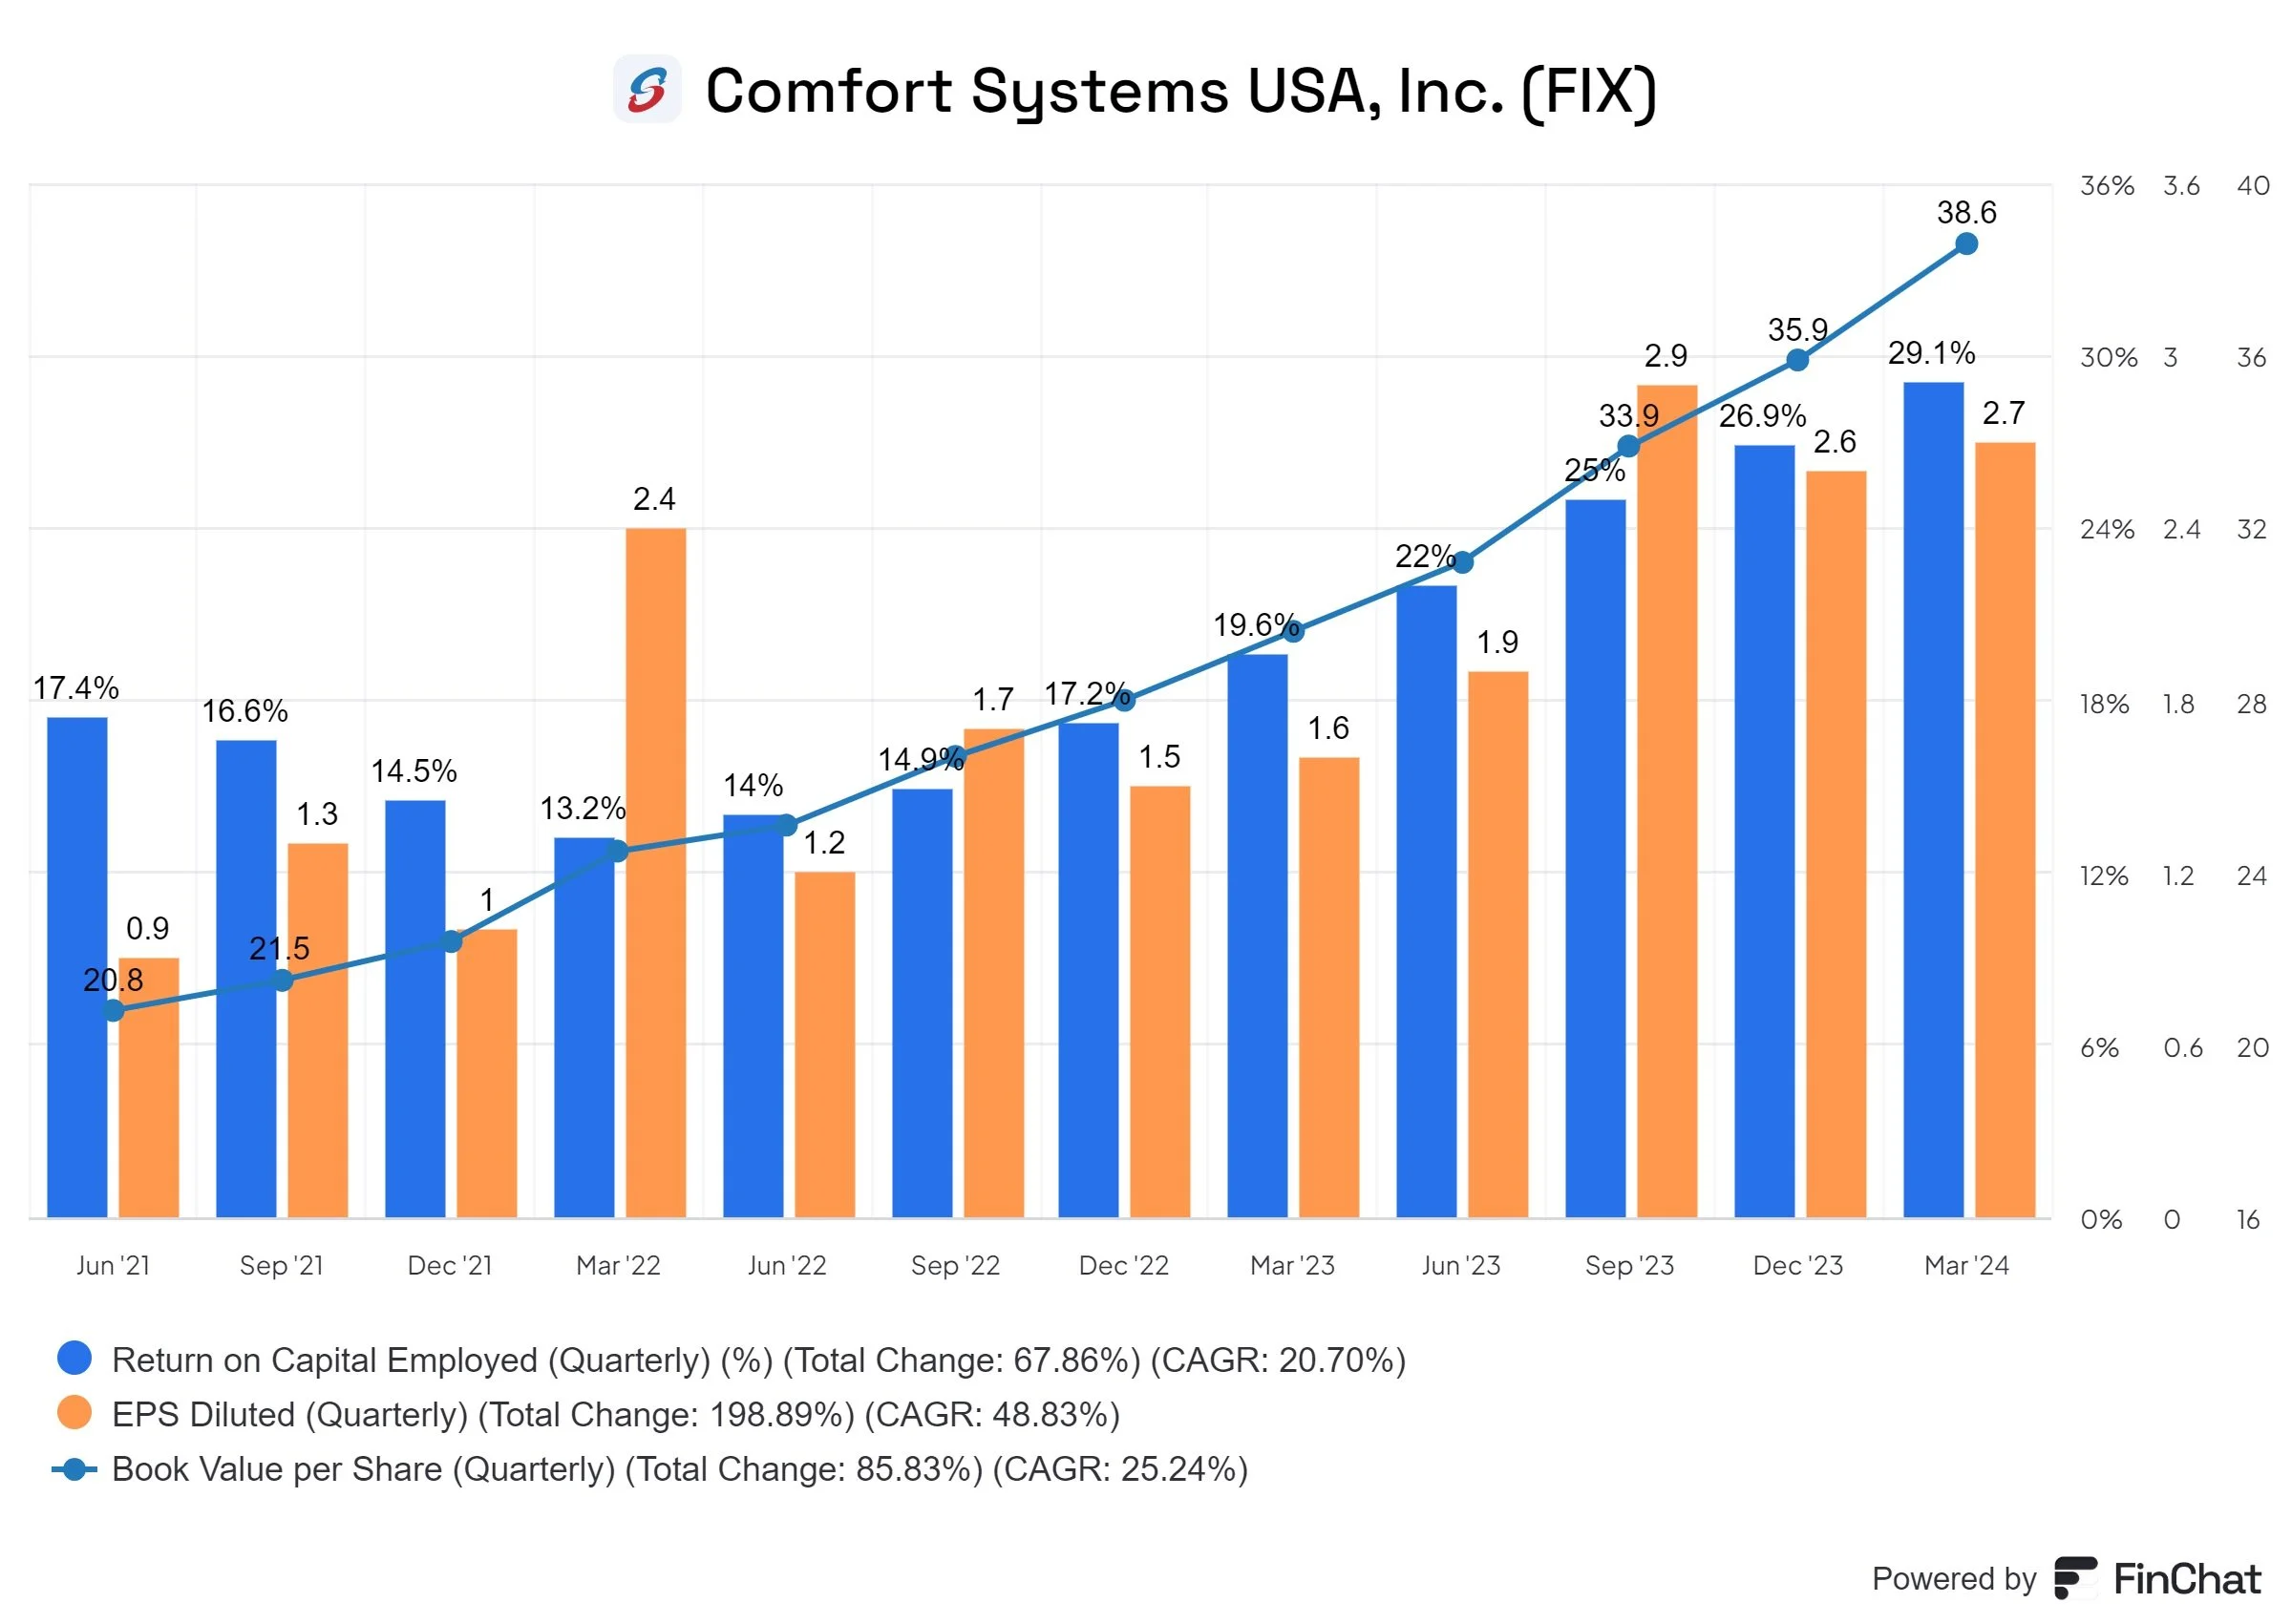
Comfort Systems USA (FIX) Case Study
Comfort Systems USA (NYSE:FIX) based in Houston, TX provides mechanical and electrical contracting services principally to the new-build construction market. The mechanical segment (~75% of revenues) includes heating, ventilation and air-conditioning (HVAC), plumbing, piping and controls while the electrical segment (~25% of revenues) includes installation and servicing of electrical systems. While contracts are generally agreed upfront on a fixed price basis and require complex cost assumptions, in 1Q2025 and the previous year 1Q2024, FIX recorded positive impacts to revenue of +5.8% and +4.1% due to changes in estimates associated with performance obligations.
Timing differences in revenue recognition and billing create contract assets (revenue recognized exceeds billing) or contract liabilities (billing exceeds revenue recognized). Construction businesses often face poor working capital dynamics, as they incur upfront labor and material costs before receiving payment from customers.
However, FIX has carefully managed its working capital, often generated cash from a mix of customer deposits and favorable billing cycles. As of 1Q2025, FIX has ~$205mm of cash on its balance sheet, and contract liabilities exceed contract assets by over $1 billion while total debt has remained around $70mm for the past year. Cash from operations was -$88 million for 1Q2025 compared to +$146.5mm in 1Q2024.
Data Center construction has been a key revenue driver for FIX - in 1Q2025 revenues of $1.8 billion increased 19% YoY inclusive of 3.7% increase related to business acquisitions while operating income increased 55% YoY and contracted backlog increased 16.5% YoY to $6.9 billion (representing almost 12 months of revenue).
At Eaglestone Capital, we love companies that earn high returns on capital employed (ROCE) while growing earning per share (EPS) and compounding book value. Over the past 1Q2025, FIX grew EPS 77% and book value per share 30% while growing ROCE to 41.8% over the past year as detailed below.

Regards,
Eaglestone Capital Management LLC
66 Palmer Avenue, Suite 32B, Bronxville, NY 10708
914.202.8811
www.eaglestonecapital.net
Eaglestone Capital Management LLC prepared this letter. NAV Fund Services, our administrator, is responsible for the distribution of this information and not its content.
Eaglestone Capital’s Investment Philosophy
Eaglestone Capital is an independent registered investment adviser (RIA) based in Bronxville, NY, founded by Fred Stupart. It serves as the sole investment adviser to Eaglestone Capital Partners LP (the “Fund”), which targets 15% absolute annual returns to its limited partners through investments in daily-liquid securities. The Fund primarily invests in U.S. equities and may employ leverage to boost returns. The Fund offers an alternative to the array of index funds, annuities, and other common products available to individuals seeking a secure retirement.
Eaglestone Capital views the U.S. economy as sui generis —truly one of a kind: unparalleled, irreplaceable, and impossible to replicate. Consequently, applying insights drawn from U.S. data to other markets can yield misleading conclusions. Furthermore, the foundation of continued U.S. economic growth—encompassing employment gains, real estate appreciation, and other asset expansion—is its dynamic, highly competitive private sector, exemplified by many publicly traded firms. As a result, investing in high-quality U.S. companies that uphold shareholder rights is vital to any robust investment strategy. Furthermore, Eaglestone Capital appreciates the opportunities available outside the U.S. but prefers to invest with U.S. companies with foreign subsidiaries as the best means of taking advantage of such non-U.S. opportunities.
Eaglestone Capital also believes in the individual’s power to independently analyze and choose their path to economic freedom. Today’s investors are well-informed and enjoy abundant investment choices. Although we applaud rising participation in U.S. equity markets, the growing concentration of a few companies in major equity indexes could dampen equity index returns if margins or topline growth at those companies decline and investors become more selective.
Eaglestone Capital believes that intelligence, effort, and patience yield the best results. While this should be self-evident, many index fund philosophies conflict with it. When Jack Bogle introduced the S&P 500 index fund in 1976, he offered a new, low-cost product that helped keep large asset managers honest. Yet what is initially a clever innovation often becomes overused. We may soon see many index funds lag behind AI-empowered active managers able to allocate capital more flexibly.
Eaglestone Capital oversees a portfolio of 20–30 liquid equities, each run by leadership teams possessing a “fiduciary gene”—managers who respect shareholder rights and strive to develop innovative, capital-efficient businesses that deliver strong returns to owners. Eaglestone Capital recognizes that risks and rewards vary widely across the U.S. economy, welcoming multiple industries and business models into its portfolio. Some firms have attained scale and efficiency and thus generate high margins and robust returns on capital. Others, analogous to partially finished real estate developments, still have room to grow margins and returns on capital and hence during this “development phase” they might appear to have very high valuations based on traditional EV/EBIT or P/E multiples.
Finally, Eaglestone Capital acknowledges the U.S. equity market’s potential volatility, as shifting momentum can strongly influence investor behavior. However, Eaglestone Capital does not equate volatility with risk – in fact, volatility is a key benefit available only to public market investors seeking high absolute returns. Sometimes “the market” decides that it wants to sell stocks – Eaglestone Capital respects the market’s momentum, appreciates its power and will wait for an appropriate time to exercise any judgement.
General Disclaimer
By accepting this investment letter, you agree that you will not divulge any information contained herein to any other party. This letter and its contents are confidential and proprietary information of the Fund and any reproduction of this information, in whole or in part, without the prior written consent of the Fund is prohibited.
The information contained in this letter reflects the opinions and projections of Eaglestone Capital Management LLC (the "General Partner") and its affiliates as of the date of publication, which are subject to change without notice at any time after the date of issue. All information provided is for informational purposes only and should not be deemed as investment advice or a recommendation to purchase or sell any specific security. All performance results are based on the net asset value of the Fund. Net performance results are presented net of management fees, brokerage commissions, administrative expenses, and accrued performance allocation, as indicated, and include the reinvestment of all dividends, interest, and capital gains. The performance results represent Fund-level returns and are not an estimate of any specific investor’s actual performance, which may be materially different from such performance depending on numerous factors.
The market indices appearing in this letter have been selected for the purpose of comparing the performance of an investment in the Fund with certain well-known equity benchmarks. Statistical data regarding the indices has been obtained from public sources and the returns are calculated assuming all dividends are reinvested. The indices are not subject to any of the fees or expenses to which the funds are subject and may involve significantly less risk than the Fund. The Fund is not restricted to investing in those securities which comprise these indices, its performance may or may not correlate to these indices, and it should not be considered a proxy for these indices. The S&P 500 Total Return Index is a market cap weighted index of 500 widely held stocks often used as a proxy for the overall U.S. equity market. The Fund consists of securities which vary significantly from those in the benchmark indices. Accordingly, comparing results shown to those of such indices may be of limited use.
Statements herein that reflect projections or expectations of the future financial or economic performance of the Fund are forward-looking statements. Such "forward-looking" statements are based on various assumptions, which may not prove to be correct. Accordingly, there can be no assurance that such assumptions and statements will accurately predict future events or the Fund's actual performance. No representation or warranty can be given so that the estimates, opinions, or assumptions made herein will prove to be accurate. Any projections and forward-looking statements included herein should be considered speculative and are qualified in their entirety by the information and risks disclosed in the Fund's Private Placement Memorandum. Actual results for any period may or may not approximate such forward-looking statements. You are advised to consult with your own independent tax and business advisors concerning the validity and reasonableness of any factual, accounting and tax assumptions. No representations or warranties whatsoever are made by the Fund, the General Partner, or any other person or entity as to the future profitability of the Fund or the results of making an investment in the Fund. Past performance is not a guarantee of future results.
The funds described herein are unregistered private investment funds commonly called "hedge funds" (each, a "Private Fund"). Private Funds, depending upon their investment objectives and strategies, may invest and trade in a variety of different markets, strategies and instruments (including securities and derivatives) and are NOT subject to the same regulatory requirements as mutual funds, including requirements to provide certain periodic and standardized pricing and valuation information to investors.
There are substantial risks in investing in a Private Fund. Prospective investors should note that:
- A Private Fund represents a speculative investment and involves a high degree of risk.
- Investors must have the financial ability, sophistication/experience, and willingness to bear the risks of an investment in a Private Fund.
- An investor could lose all or a substantial portion of his/her/its investment.
- An investment in a Private Fund is not suitable for all investors and should be discretionary capital set aside strictly for speculative purposes.
- Only qualified eligible investors may invest in a Private Fund.
- A Private Fund’s prospectus or offering documents are not reviewed or approved by federal or state regulators and its privately placed interests are not federally, or state registered.
- An investment in a Private Fund may be illiquid and there are significant restrictions on transferring or redeeming interests in a Private Fund.
- There is no recognized secondary market for an investor’s interest in a Private Fund and none is expected to develop.
- A Private Fund may have little or no operating history or performance and may use performance information which may not reflect actual trading of the Private Fund and should be reviewed carefully.
- Investors should not place undue reliance on hypothetical, pro forma or predecessor performance.
- A Private Fund’s manager/advisor has total trading authority over a Private Fund.
- The death or disability of a key person, or their departure, may have a material adverse effect on a Private Fund.
- A Private Fund may use a single manager/advisor or employ a single strategy, which could mean a lack of diversification and higher risk.
- A Private Fund may involve a complex tax structure, which should be reviewed carefully, and may involve structures or strategies that may cause delays in important financial and tax information being sent to investors.
- A Private Fund’s fees and expenses, which may be substantial regardless of any positive return, will offset such Private Fund’s trading profits.
- If a Private Fund’s investments are not successful or are not sufficiently successful, these payments and expenses may, over a period, significantly reduce or deplete the net asset value of the Private Fund. A Private Fund and its managers/advisors and their affiliates may be subject to various potential and actual conflicts of interest.
- A Private Fund may employ investment techniques or measures aimed at reducing the risk of loss which may not be successful or fully successful.
- A Private Fund may employ leverage, including involving derivatives. Leverage presents specialized risks.
- The more leverage used, the more likely a substantial change in value may occur, either up or down.
The above summary is not a complete list of the risks, tax considerations and other important disclosures involved in investing in a Private Fund and is subject to the more complete disclosures in such Private Fund’s offering documents, which must be reviewed carefully prior to making an investment.
Eaglestone Capital Management LLC is an independent investment advisory firm based in Bronxville, New York. Additional information about Eaglestone Capital Management LLC and its associated persons (including Form ADV) is available on the SEC’s website at www.adviserinfo.sec.gov. You can search this site by a unique identifying number, known as a CRD number. The CRD number for Eaglestone Capital Management LLC is 297958.

Investors Edge Podcast S1:E3
https://youtu.be/HUxo13Zf_90?si=WVc_rGVikrfZBZHl
Navigating the Complex World of Property & Casualty Insurance Investing
In this episode of the Investors Edge Podcast, host Fred Stupart dives deep into the property and casualty (P&C) insurance market, exploring investment opportunities and the nuances of evaluating P&C insurers. Fred revisits the aftermath of Hurricane Milton, examines the concept of insurance float, shares insights on past insurance market challenges like the AIG collapse, and compares P&C insurance to health insurance. With a focus on underwriting discipline and investment returns, this episode offers a comprehensive analysis of why P&C insurers can be a compelling asset class. Don't miss Fred's detailed breakdown of how to evaluate insurers using metrics like the combined ratio and return on insurance float.
00:00 Introduction to the Investors Edge Podcast
00:30 Understanding the Property and Casualty Insurance Market
00:40 The Impact of Hurricane Milton on Insurance Stocks
00:57 Why Invest in Property Casualty Insurance Companies?
02:23 Challenges and Opportunities in the Insurance Industry
03:58 The AIG Collapse: A Case Study
08:05 The Importance of Good Management in Insurance
09:13 Deep Dive into the U.S. Property Casualty Insurance Market
12:18 Evaluating Insurance Companies: Metrics and Strategies
16:30 Comparing P&C Insurance with Health Insurance
27:12 State Farm and the Current P&C Insurance Market
28:25 Valuation of P&C Insurance Companies
31:45 Conclusion and Final Thoughts
Investors Edge Podcast S1E3: Navigating the Complex World of Property & Casualty Insurance Investing
In this episode of the Investors Edge Podcast, host Fred Stupart dives deep into the property and casualty (P&C) insurance market, exploring investment opportunities and the nuances of evaluating P&C insurers. Fred revisits the aftermath of Hurricane Milton, examines the concept of insurance float, shares insights on past insurance market challenges like the AIG collapse, and compares P&C insurance to health insurance. With a focus on underwriting discipline and investment returns, this episode offers a comprehensive analysis of why P&C insurers can be a compelling asset class. Don't miss Fred's detailed breakdown of how to evaluate insurers using metrics like the combined ratio and return on insurance float.
00:00 Introduction to the Investors Edge Podcast
00:30 Understanding the Property and Casualty Insurance Market
00:40 The Impact of Hurricane Milton on Insurance Stocks
00:57 Why Invest in Property Casualty Insurance Companies?
02:23 Challenges and Opportunities in the Insurance Industry
03:58 The AIG Collapse: A Case Study
08:05 The Importance of Good Management in Insurance
09:13 Deep Dive into the U.S. Property Casualty Insurance Market
12:18 Evaluating Insurance Companies: Metrics and Strategies
16:30 Comparing P&C Insurance with Health Insurance
27:12 State Farm and the Current P&C Insurance Market
28:25 Valuation of P&C Insurance Companies
31:45 Conclusion and Final Thoughts

Investors Edge Podcast S1:E2
https://youtu.be/v37MBHy5mWw?si=oELOyd-064REggB6
In this episode of the Investor's Edge Podcast, host Fred Stupart dives into the distinction between share price volatility and business fundamentals. The discussion features insights from Warren Buffett on the limitations of volatility as a risk measure, real-world examples from Hurricane Milton's impact on insurance stocks, and perspectives from Howard Marks on the true nature of risk. Tune in to learn why share prices can move independently of business performance and how this volatility can present opportunities for individual investors.
00:00 Introduction to Investor's Edge Podcast
00:28 Understanding Share Price Volatility
02:57 Real-World Example: Hurricane Milton's Impact
04:03 Analyzing Insurance Stocks: Kinsale and Arch Capital
07:09 Howard Marks on Risk and Volatility
10:35 Measuring Volatility and Risk Metrics
12:11 Conclusion and Final Thoughts
Investors Edge Podcast Episode 2: Understanding Share Price Volatility vs. Business Fundamentals
Understanding Share Price Volatility vs. Business Fundamentals | Investor's Edge Podcast
In this episode of the Investor's Edge Podcast, host Fred Stupart dives into the distinction between share price volatility and business fundamentals. The discussion features insights from Warren Buffett on the limitations of volatility as a risk measure, real-world examples from Hurricane Milton's impact on insurance stocks, and perspectives from Howard Marks on the true nature of risk. Tune in to learn why share prices can move independently of business performance and how this volatility can present opportunities for individual investors.
00:00 Introduction to Investor's Edge Podcast
00:28 Understanding Share Price Volatility
02:57 Real-World Example: Hurricane Milton's Impact
04:03 Analyzing Insurance Stocks: Kinsale and Arch Capital
07:09 Howard Marks on Risk and Volatility
10:35 Measuring Volatility and Risk Metrics
12:11 Conclusion and Final Thoughts

Investors Edge Podcast S1:E1
https://youtu.be/b7yxh9u_VK8?si=juiaDbkHVA-yeqOu
Episode 1: Navigating Market Emotions and Rational Decisions: Insights from Past Crises
In this episode of the Investor's Edge podcast, host Fred Stupart delves into the psychology of investing, highlighting how emotions can cloud rational thinking during volatile market conditions. He shares his experiences from the Asian currency crisis of 1997-1998 and the COVID-19 pandemic's initial market impact in 2020. Fred analyzes a real-time interview with investor Bill Ackman to illustrate the clash between emotional and logical decision-making. He also references Daniel Kahneman's System 1 and System 2 thinking to explain how investors can better manage their reactions and decisions. Join us for valuable lessons on recognizing and overcoming biases and fears in investing.
00:00 Introduction to the Investor's Edge Podcast
00:36 Understanding Investing Psychology
00:55 Historical Market Volatility: 1997-1998
01:52 COVID-19: A Recent Case Study
03:27 Bill Ackman's Emotional vs. Rational Battle
05:21 Analyzing COVID-19's Impact on Markets
11:51 Daniel Kahneman's System 1 vs. System 2 Thinking
16:20 Conclusion and Takeaways
U.S. House Prices Rise 5.7 Percent over the Last Year
The U.S. house prices increased by 5.7% from the second quarter of 2023 to the second quarter of 2024, as reported by the FHFA House Price Index (HPI). This marks a 0.9% rise from the first quarter of 2024. However, on a monthly basis, the seasonally adjusted index for June 2024 showed a slight decline of 0.1% compared to May 2024.
Dr. Anju Vajja, Deputy Director for FHFA’s Division of Research and Statistics, noted that this slowdown in quarterly growth is attributed to a higher inventory of homes for sale and elevated mortgage rates, which have tempered the pace of appreciation in the housing market.
However, a decline in mortgage rates could help to drive the market higher in future quarters.
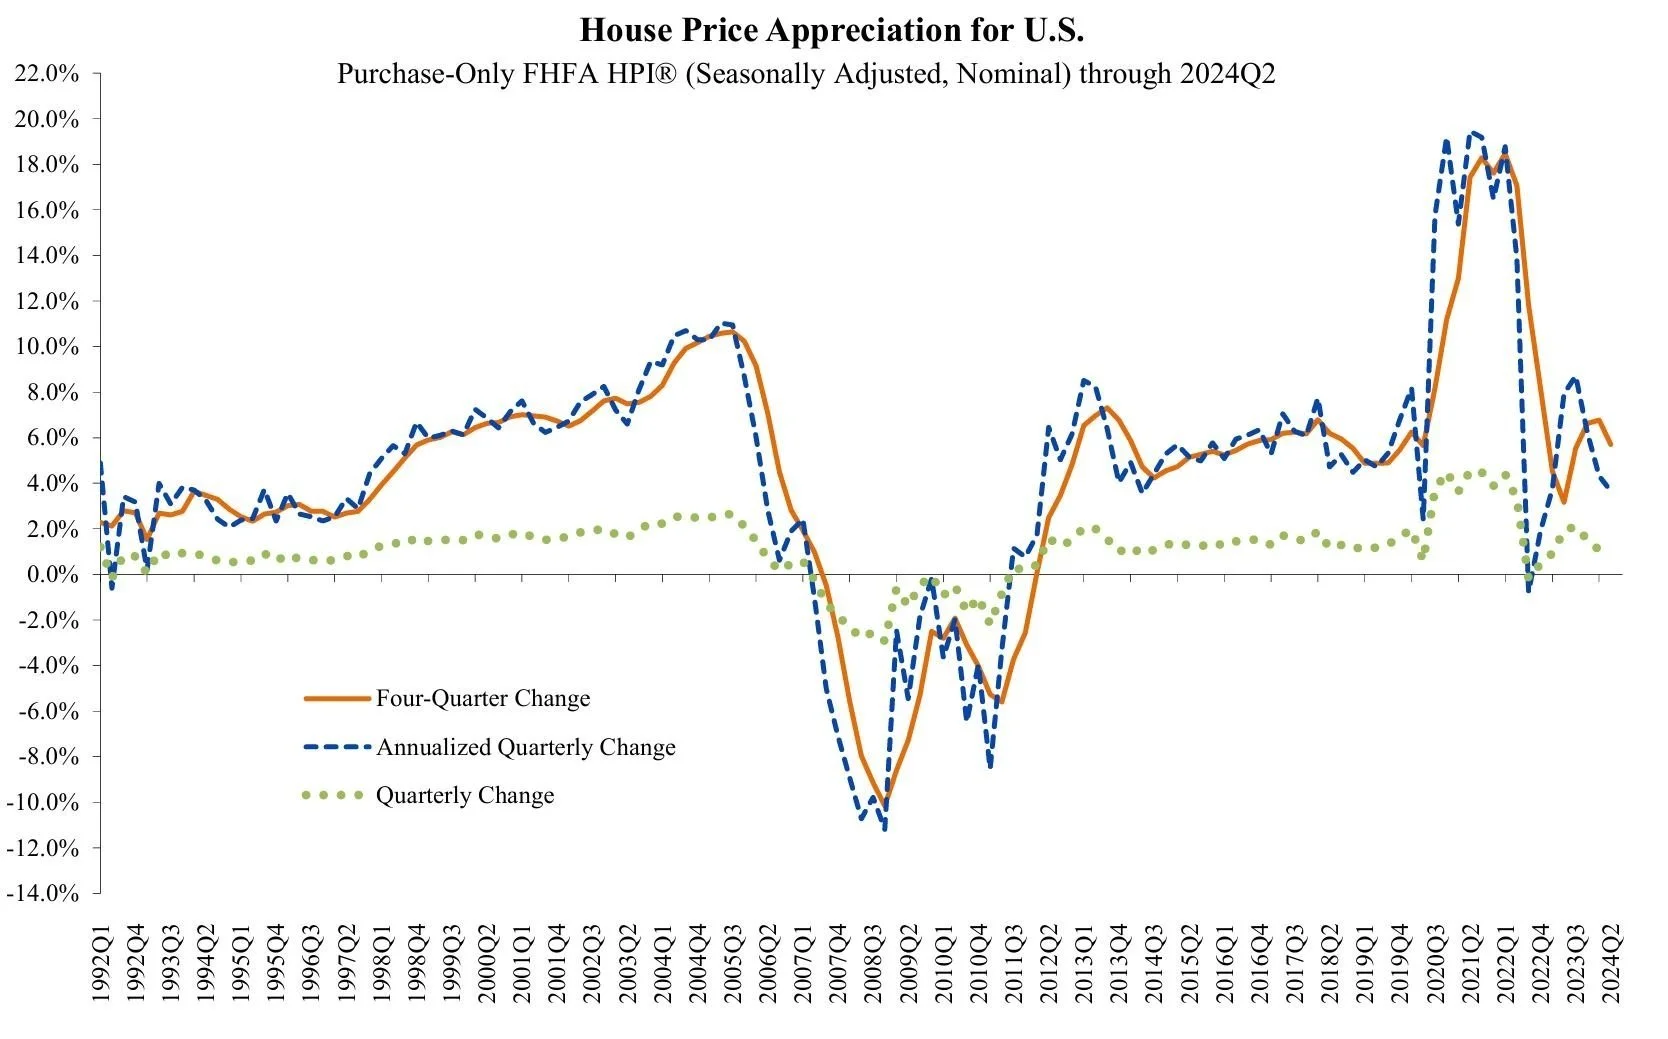
Travelers (TRV) vs Progressive (PGR) - Not all Insurance Companies Are Created Equal
This past week, both Travelers (TRV) and Progressive (PGR) reported 2Q2024 financials and interestingly they demonstrated the importance of a good underwriting platform. Progressive derives about 85% of its premiums earned underwriting personal auto/vehicle and home insurance. For the 2Q2024, PGR grew premiums earned by 19% year over year and generated $1.4 billion of underwriting income with a combined ratio of 91.9%. In contrast, for 2Q2024 TRV grew its personal auto & home insurance premiums earned 10% to $4.1 billion but given its underwriting losses and expenses (its combined ratio was 108.5%) it generated an underwriting loss of $296 million.
Given this fundamental divergence in the core underwriting platforms of the two companies its no surprise that over the past 5 years PGR’s stock has compounded at an annual rate of 25% while TRV’s stock has compounded at an annual rate of 8% - quality matters.

The Bull Run in Property & Casualty (P&C) Insurance Continues
But Not All P&C Insurance Companies Will Benefit
A recent article “State Farm Seeking Large Rate Increases in Wildfire-Prone California” caught my attention and raised alarm bells regarding the financial condition of the largest P&C insurer in California (State Farm insures about 20% of all California homes) and indeed the largest P&C insurer in the country (NAIC 2024 Market Share Report). Apparently State Farm is requesting a 30% rate increase for its homeowners line, a 52% rate increase for renters and 36% rate increase for condo coverage - that’s a year after the carrier got California rate approvals of 7% and 20%—adding fuel to a burning homeowners crisis in a state that’s seen an increasing number of carriers pullback or raise rates in the last year.
State Farm is not doing well - they reported a monster $14.1 billion underwriting loss in FY2023 and that’s after a $13.2 billion underwriting loss in FY2022.
Which P&C insurers are earning underwriting profits? The U.S. P&C insurance market has been on a tear for the past several years - and recent May 2024 premium data continues to demonstrate strength with lines like personal auto up over 7% year over year.
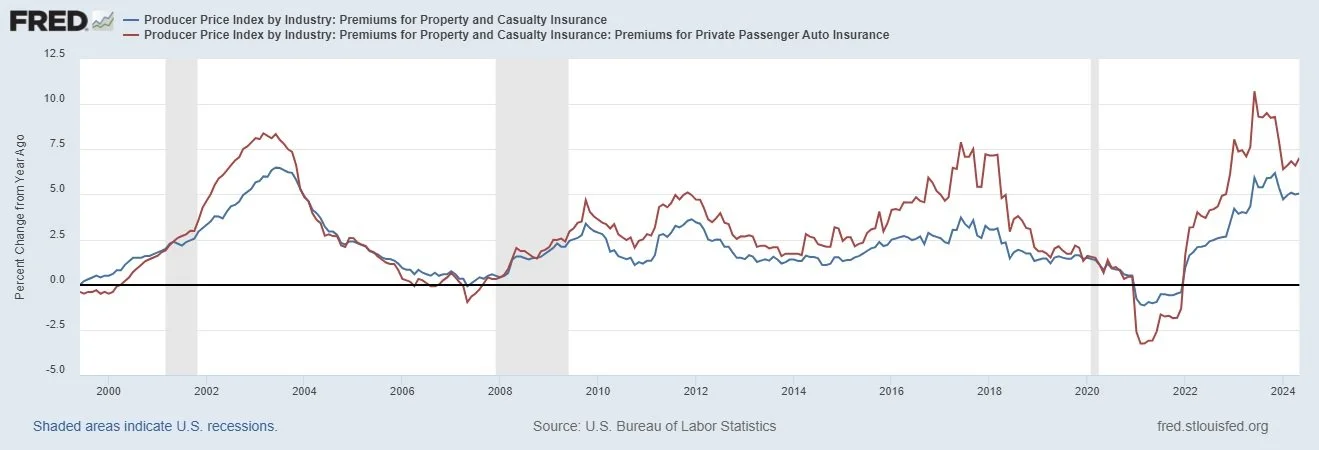
Take a look at a well run P&C re-insurer such as Arch Capital Group Ltd. (ACGL) which has been generating underwriting profits for the past decade -most recently in 1Q2024 ACGL grew revenues at a 29% annual rate and generated returns on book equity over 29% while the stock trades at 8x earnings.

China/U.S. Freight Costs Rising - Is the U.S. Supply Chain Next?
How to Play A Rebounding U.S. Supply Chain
Domestic LTL Trucking Companies Offer an Attractive Option
Over the past two months, we’ve been following re-bounding 40’ ocean going container rates, specifically the cost to ship goods from China to the U.S. West Coast. The Freightos FBX01 rate for example has risen over 127% from $3095 in April 2024 to over $7052 as of last week.

A number of explanations exist - disruptions in the Red Sea, retailers pre-buying in fear of post-election tariffs - however, there’s also something happening in the domestic supply chain that suggests the effects might be more substantial. Inferred rates withing the domestic Cass Freight Index have started to move and historically changes in the price of the two indexes (FBX01 and Cass Freight Index Inferred Prices) have been strongly corelated using a 5 month lag (i.e. the FBX01 rates “forecast” the Cass Freight Inferred Prices with a 5 month lag).
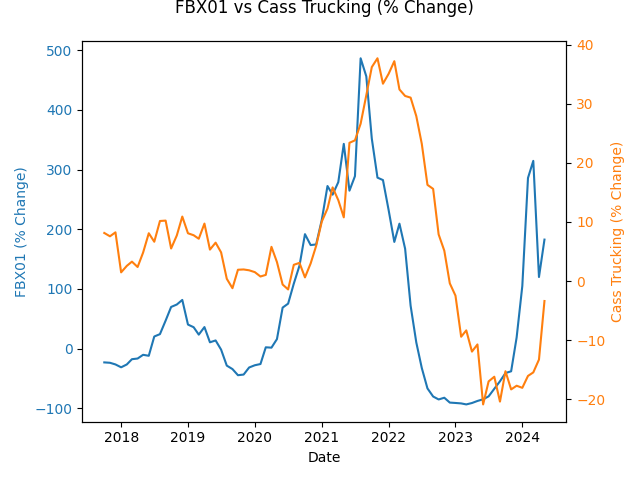
One idea is to look at the LTL trucking industry - Old Dominion Freight Lines (ODFL) for example. ODFL has demonstrated strong returns on capital employed (ROCE) over the years - over 30% - as well as consistently building book value per share through high returns and re-investment - all for the benefit of its shareholders.
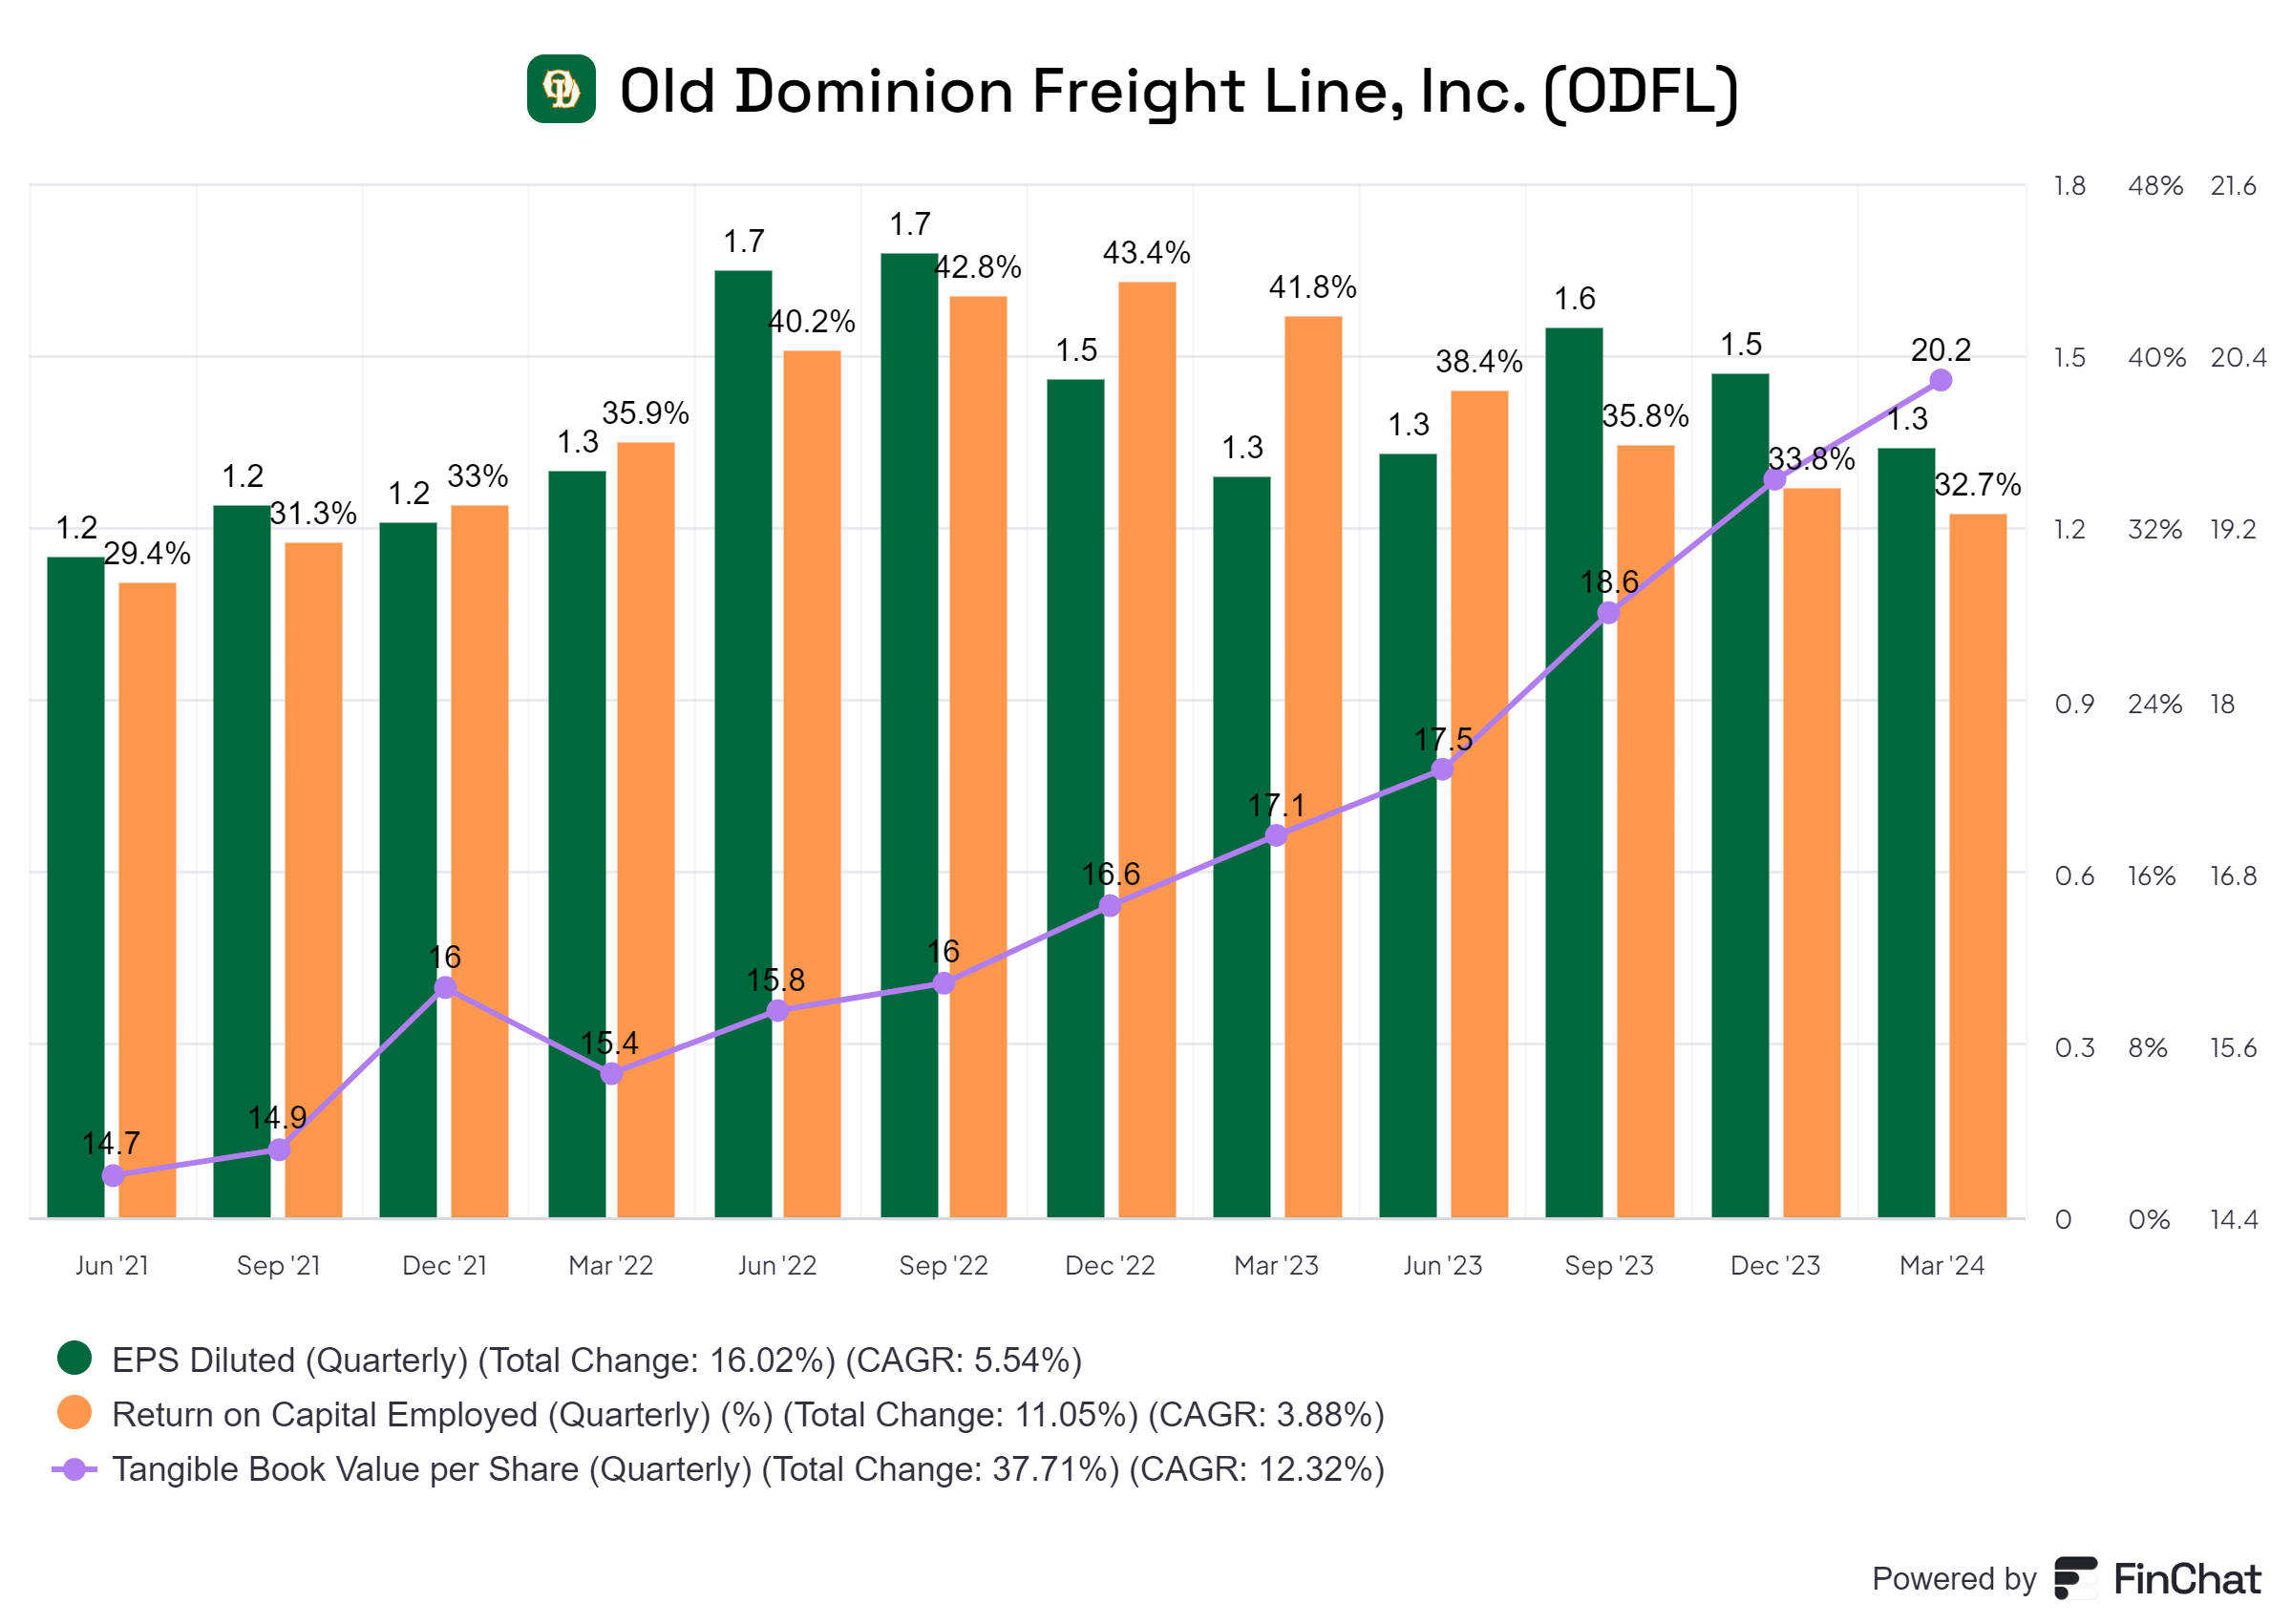
Residential Construction Update - Is the Market Rolling Over?
KB Home & Lennar Report 2Q2024 Results
KB Home (KBH) reported earnings for the quarter ending May 31, 2024 this week. Year over year, net orders were up 2%, net order value was up 7% and average selling price was up 1% however total housing revenues declined 3%, deliveries declined 4% and backlog homes declined 14%.
Lennar (LEN) also reported for the 2Q2024 - revenues increased 9% primarily due to a 15% increase in the number of home deliveries offset by a 5% decline in average selling price. Stuart Miller, CEO noted that: “affordability continued to be tested by interest rate movements and simultaneously challenged consumer sentiment, purchasers remained responsive to increased sales incentives, resulting in a 19% increase in our new orders and a 15% increase in our deliveries year over year.” However, new order prices were down 5.5% while backlog average selling price was down 2.3%
So far YTD 2024 LEN stock price is up 3.7%, KBH is up 13.7% and other residential construction players such as insulation supplier/installer TopBuild (BLD) are up 3.7% this year. Lumber prices, however, are down over 20.8% YTD.

Do Home Prices Help Predict Single Family Housing Starts?
And which ‘House Price’ Index can we trust anyways?
Going down a rabbit hole trying to find some reliable macro indicators is usually a bad idea. It turns out, that I learned something about the differences between the variety of home price indexes - and these differences appear to be statistically significant (you can read more here).
While the median home price index of the National Association of Relators (NAR) is fast to report, usually within 3 weeks of month end, the FHFA House Price Index (FHFA) and the S&P CoreLogic Case-Shiller U.S. National Home Price NSA Index (CoreLogic) usually post 7 weeks following the month end. In fact, both FHFA and CoreLogic are reporting April 2024 numbers this Tuesday June 25th.
Digging through these indexes using data starting over 30 years ago in order to test for correlation between these home price indexes and single family housing starts yields some interesting results.
The home price index that best fits a simple four month lagged prediction model of single family housing starts is the FHFA. So pay attention to the trajectory of the FHFA this week. Why? The FHFA hasn’t printed a negative year over year price decline since the end of the global financial crisis in February 2012. The FHFA reported a year over year decline for the first time in the summer of 2007 and continued to show monthly price declines until March of 2012 when it reported a year over year price increase. FHFA slowed as the Fed began raising rates in 2022 and hit a low of 3% in May 2023 before rebounding over the past year. The most recent FHFA reading for March 2024 showed 6.75% year over year home price growth.
Insulate Your Portfolio
Residential Construction Industry
TopBuild Grows Despite Slowing Housing Market
TopBuild Corp. (NYSE: BLD) headquartered in Daytona Beach, Florida engages in the installation and distribution of insulation and related building products. A majority of the business is currently focused on the new build residential construction market. 1Q2024 sales grew 1.1% YoY while operating earnings grew 8.2% YoY.
TopBuild has successfully kept ROIC above 20% since 2022 while growing book value, maintaining operating margin of 16.7% and reducing its share count.
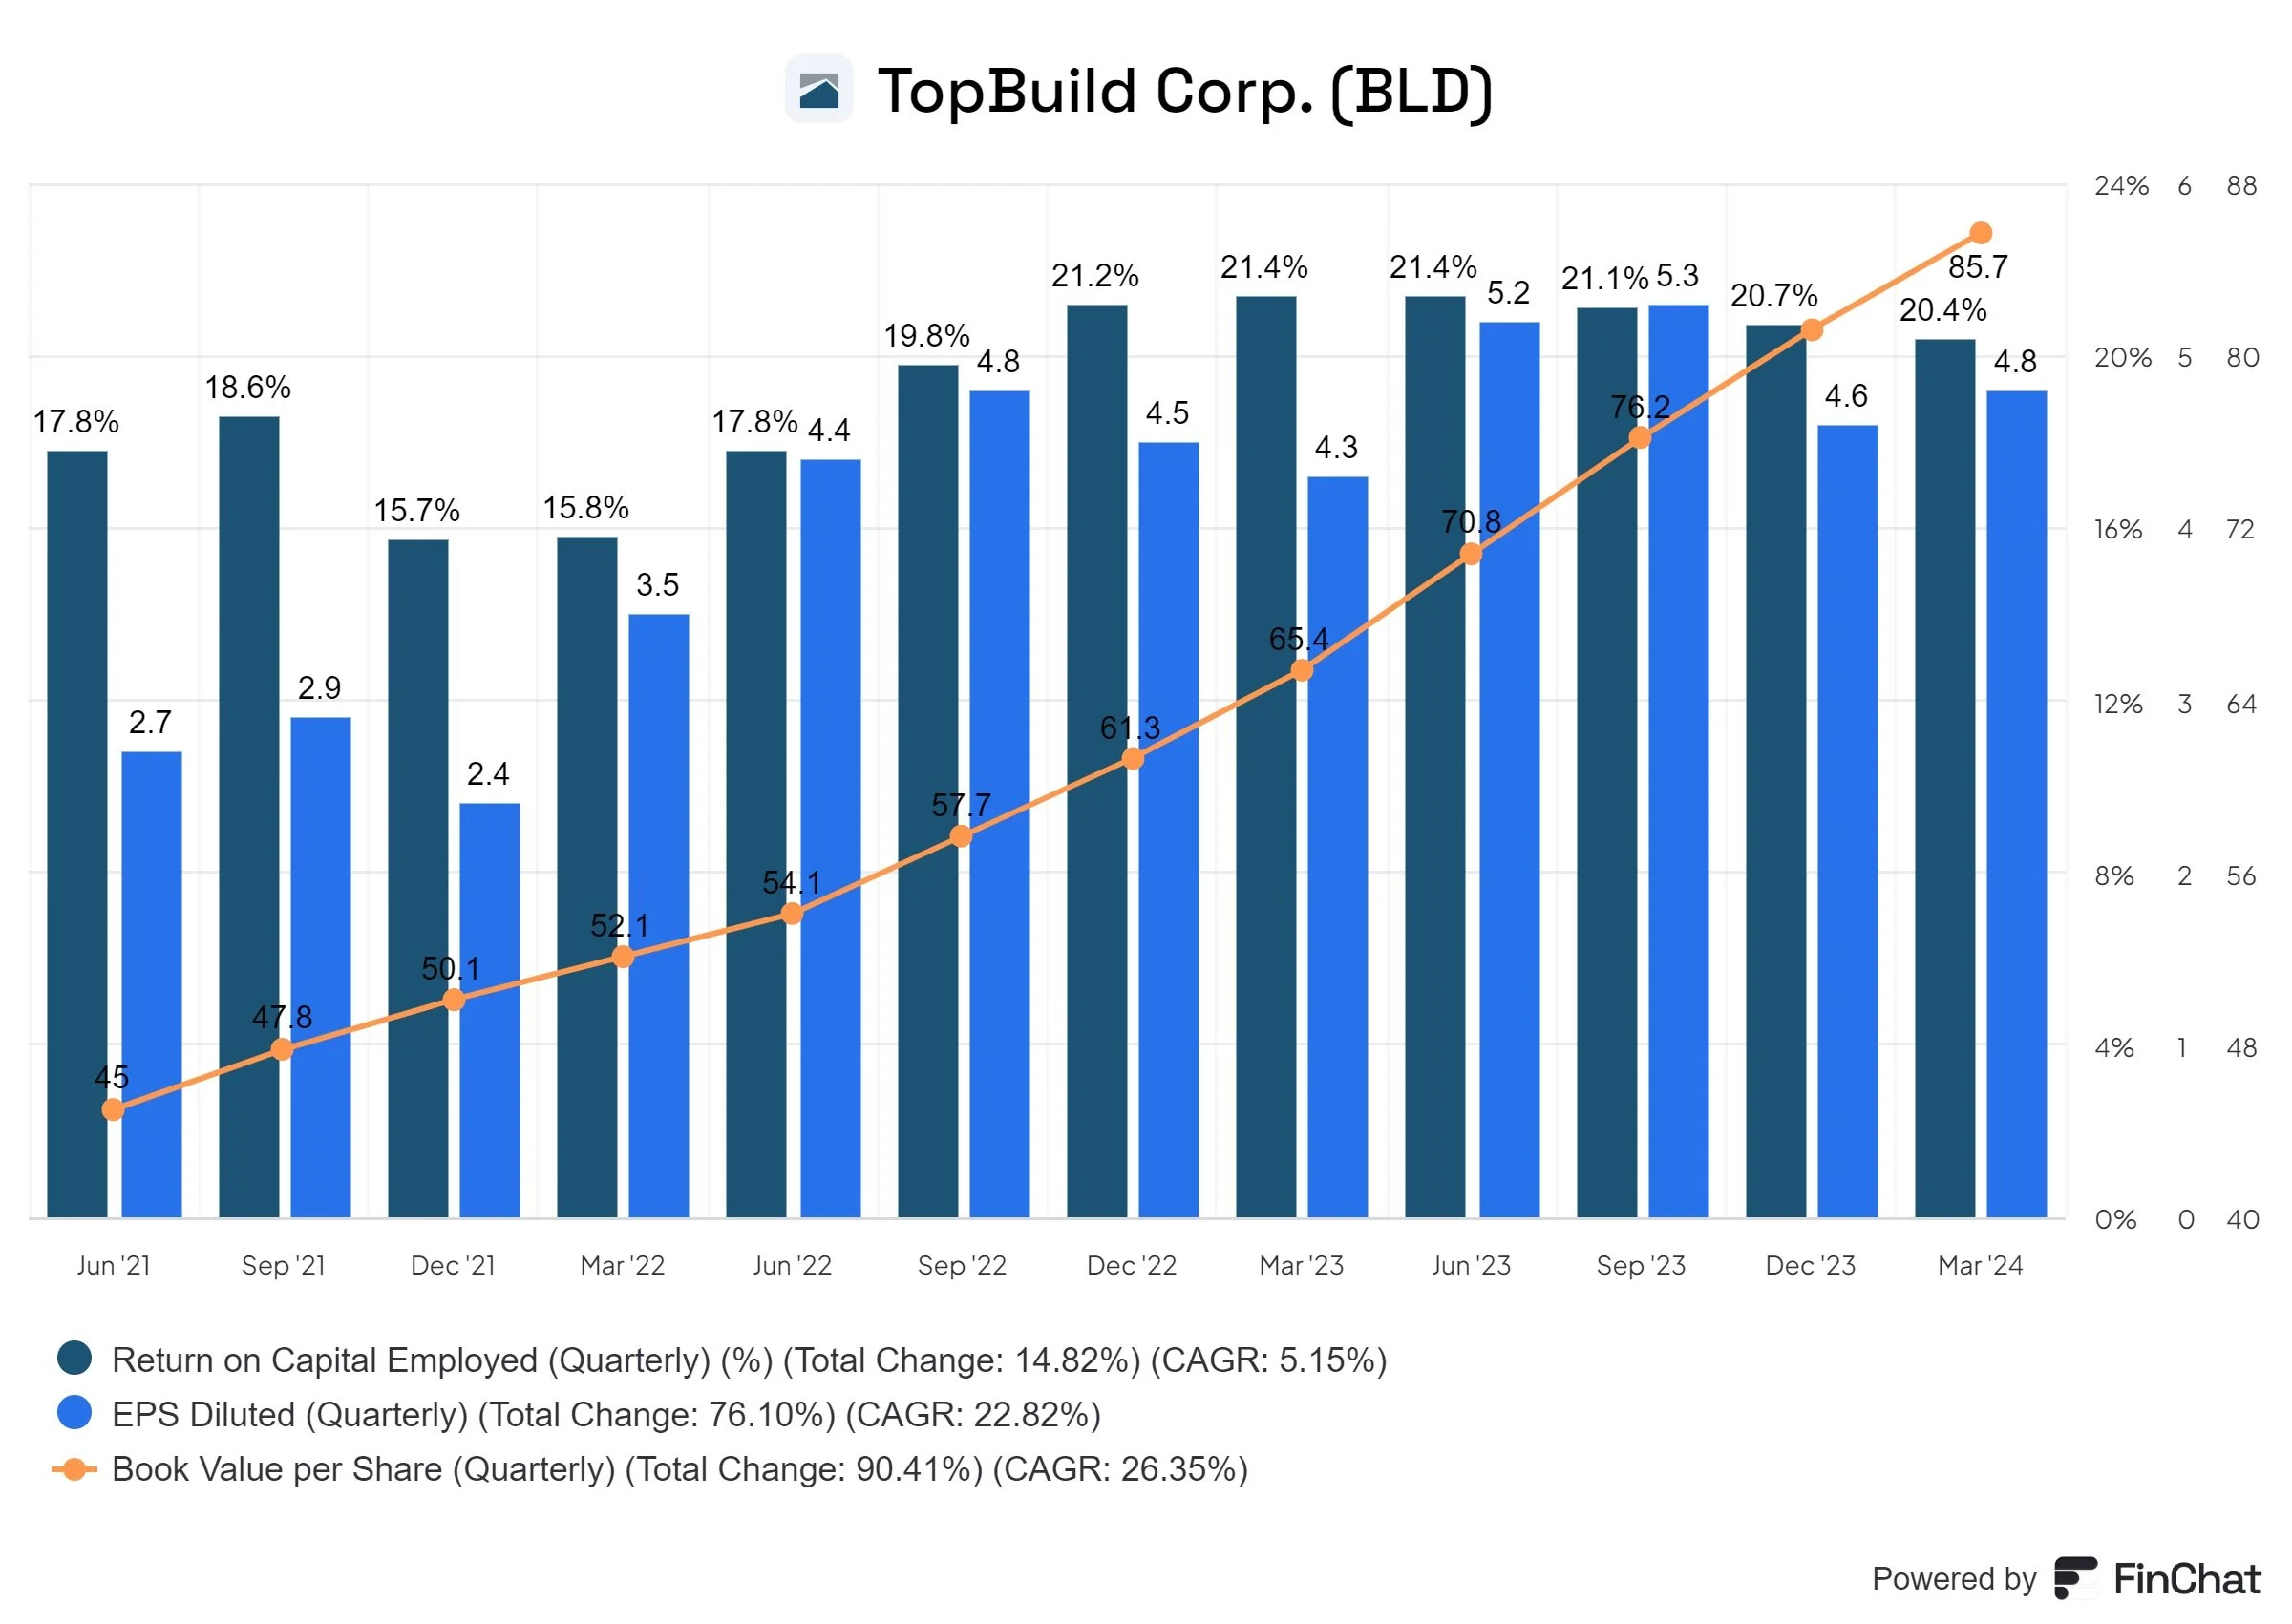
Comfort from the Heat
Construction Industry - Comfort Systems USA | 6.17.24
Comfort Systems USA is Cool
This week we’re digging into the U.S. construction sector. Why? The most recent economic data from April 2024 points to continued strength in construction spending - whether its the 11.4% annual growth in single family housing starts, the 8.1% annual growth in residential construction spending or the 11.5% annual growth in non-residential construction spending.
Comfort Systems (NYSE:FIX) based in Houston, TX is focused on the new build commercial & industrial heating ventilation and air conditioning (HVAC) services market. FIX has been growing rapidly - in 1Q2024 revenues increased 31% year over year (YoY) and operating income increased 91% YoY.
At Eaglestone Capital, we love companies that earn high returns on capital employed (ROCE) while growing earning per share (EPS) and compounding book value. Over the past year, FIX grew EPS 78% and book value per share 30% while growing ROCE from 19.6% to 29.1% over the past year.