
Are the GLD Bugs Crazy ?!
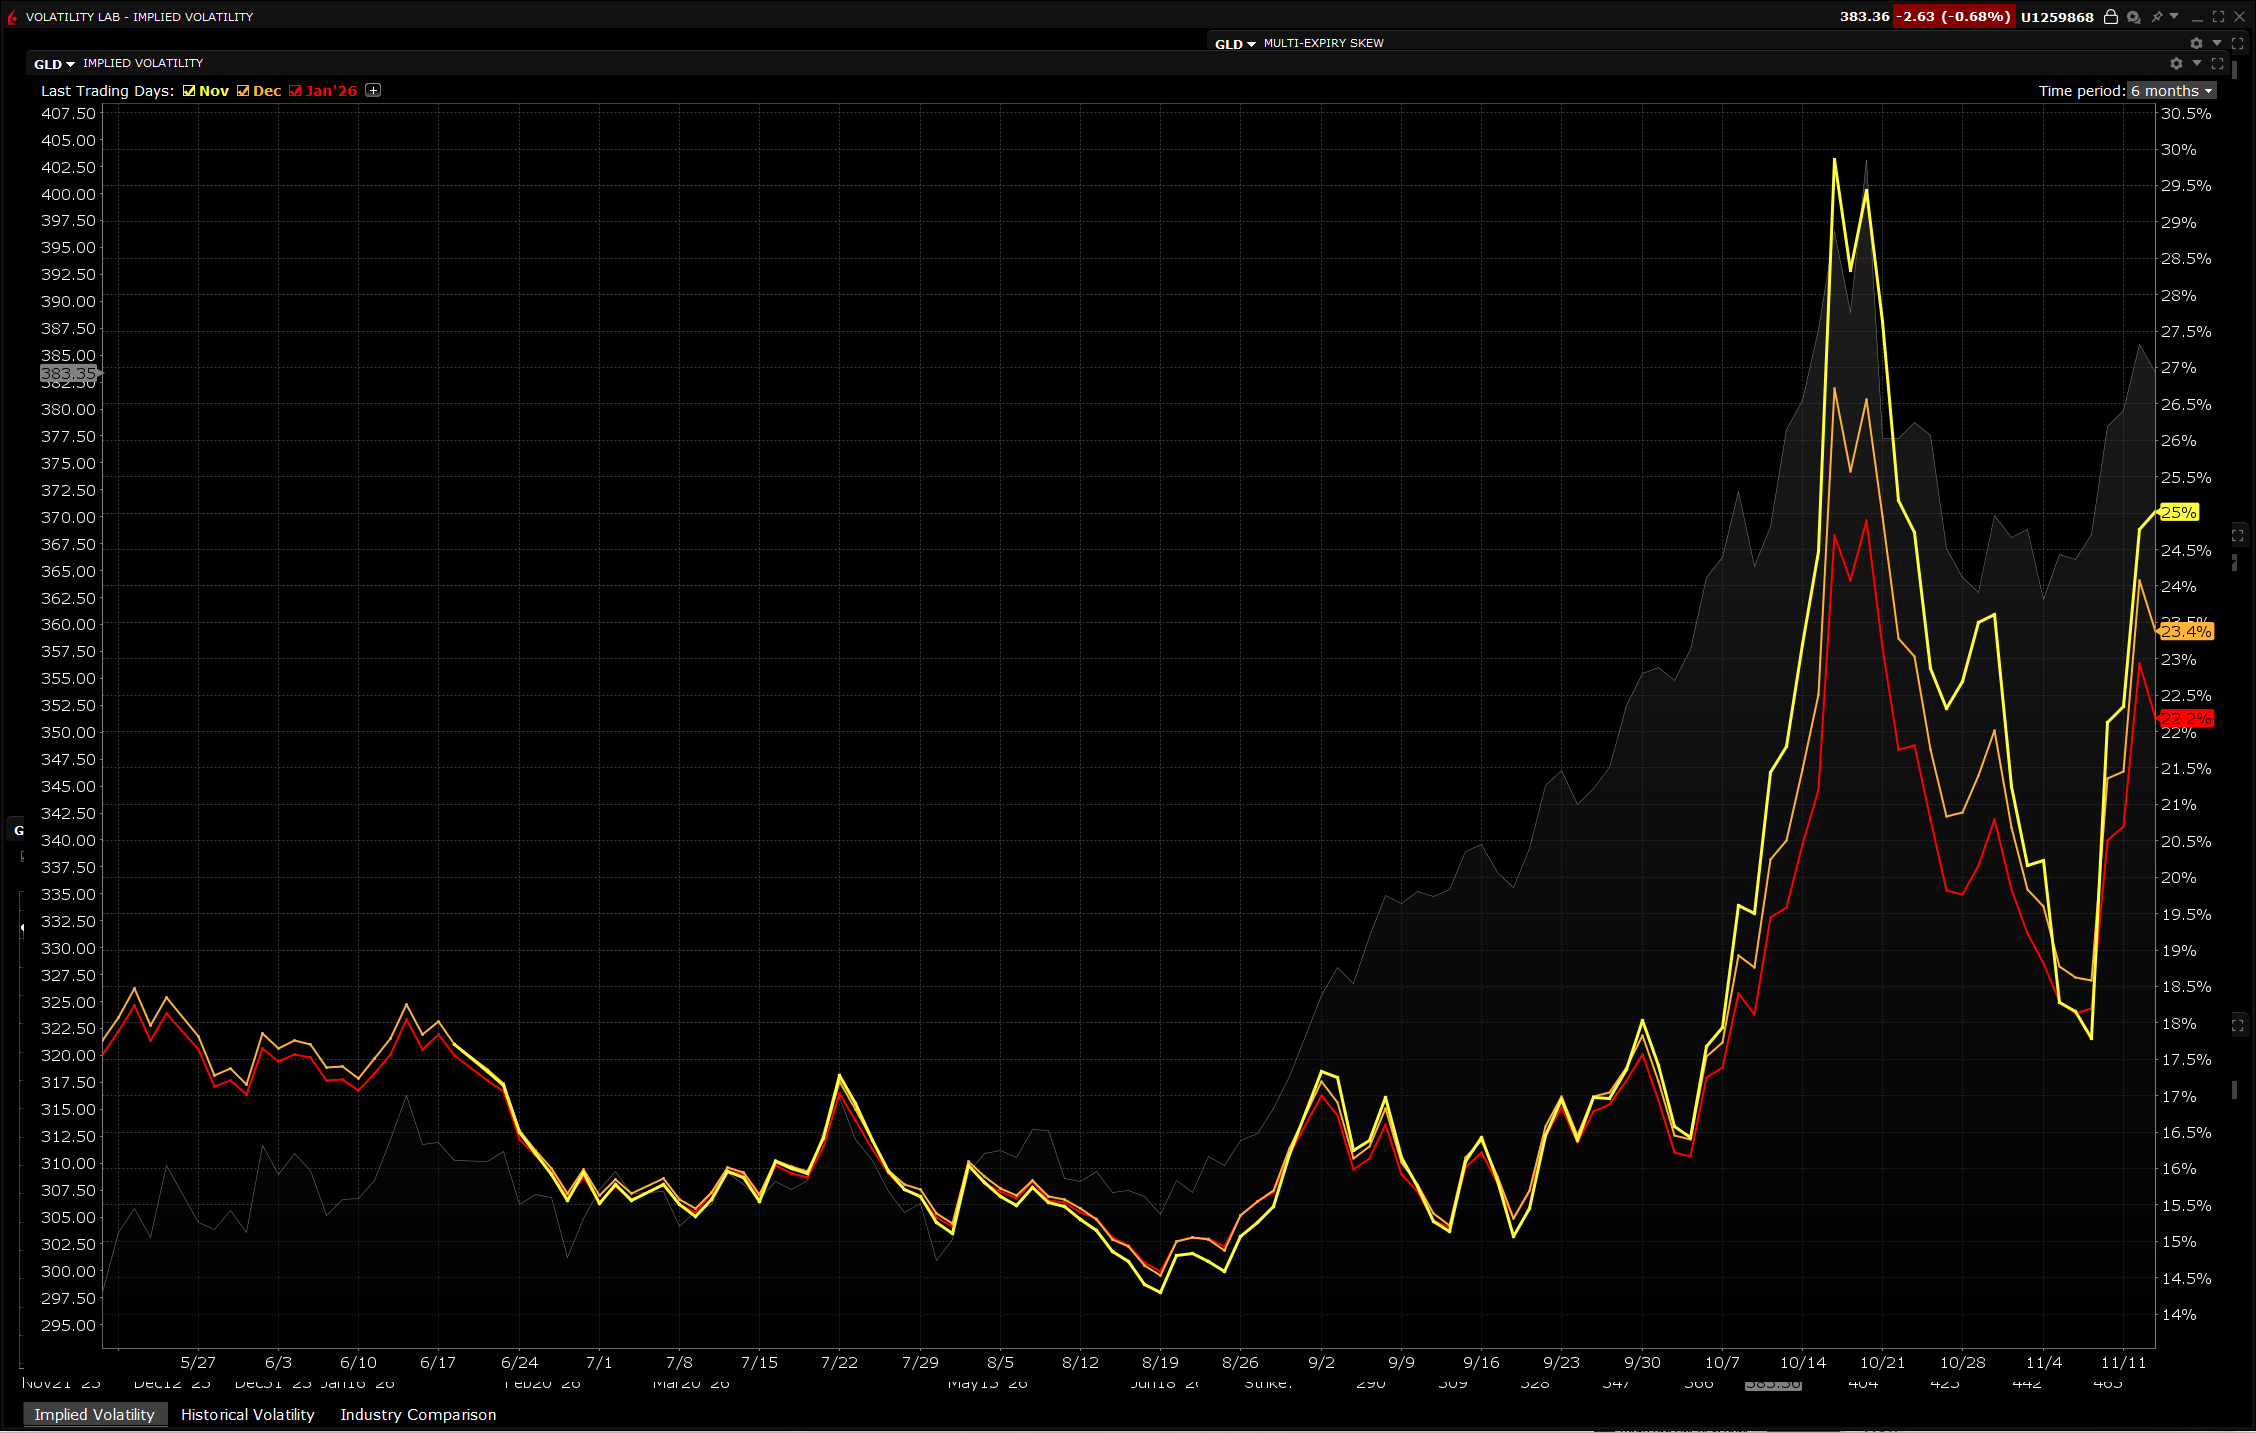
Cohorts of Implied GLD Volatility
Scrolling through LinkedIn the classic GLD bear post goes something like this:
1) GLD’s implied volatility has spiked this year (see monthly cohorts of implied volatility below)
2) Volatility always mean reverts
3) Therefore GLD’s price will decline as implied volatility mean reverts
HOWEVER- Consider the following (here’s why GLD bug’s might NOT be CRAZY):
1) GLD has a Beta of 0.14, implying that ONLY 14% of GLD’s moves are explained by moves in the S&P 500 (with a Beta of 1)
2) Hence 86% of GLD’s volatility is idiosyncratic and independent of the market moves
3) SO while GLD’s implied volatility might suggest “RISKY” the low correlation with the market MAKES GLD an excellent diversifier, actually REDUCING a portfolio’s overall volatility
Real-World Historical Behavior Patterns when SPY Crashes:
2008 Financial Crisis:
• SPY: -37%
• GLD: +5%
• Beta would predict: -5.2% (0.14 × -37%)
• Actual: Positive (safe haven bid)
2020 COVID Crash (Feb-Mar):
• SPY: -34% (peak to trough)
• GLD: -12% initially, then +25% by year-end
• Beta would predict: -4.8%
• Actual: Initial correlation, then massive divergence
2022 Bear Market:
• SPY: -18%
• GLD: -0.3%
• Beta would predict: -2.5%
• Actual: Nearly flat (held value)
Feb 19th, 2025 – April 7th, 2025 (Tariff Tantrum):
• SPY: -19%
• GLD: +1%
• Beta would predict: -2.7%
• Actual: Outperformed! (De-dollarization + inflation fears)
TODAY: November 13th, 2025 (Gov’t Re-Opened):
• SPY: -1.2%
• GLD: -0.008%
• Beta would predict: -0.17%
• Actual: Slight outperformance – GLD declined less than predicted
CONCLUSION: MAYBE THE GLD BUGS ARE ON TO SOMETHING -